Reading Graphs
How many?
More or Less
Wholes and Parts
Miscellaneous
100
This chart shows the number of rice cookers sold. Which day sold the most?
A. Sunday B. Monday C. Tuesday

A. Sunday
100
How many rice cookers were sold on Monday?

3
100
How many more rice cookers were sold on Tuesday than on Monday?
2
100
What type of graph is this?
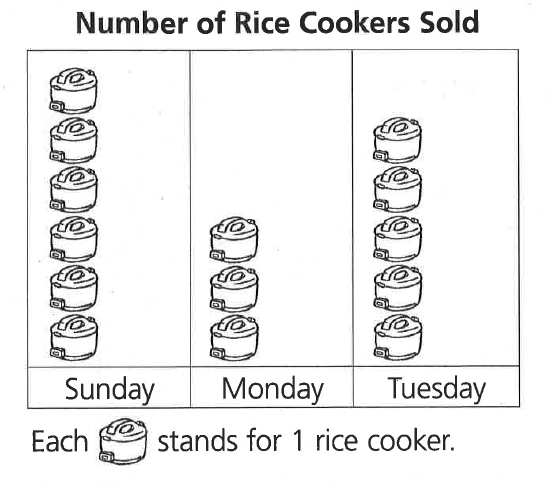
A picture graph
100
What is the title of this graph?

Number of Rice Cookers Sold
200
Which day sold the least amount of rice cookers?
A. Sunday B. Monday C. Tuesday

B. Monday
200
How many rice cookers were sold on Sunday and Monday?

9
200
How many fewer rice cookers were sold on Monday than on Sunday?
3
200
How many rice cookers were sold in all?

14 rice cookers were sold in all.
200
How much is each picture worth?
Each picture stands for 1 rice cooker.
300
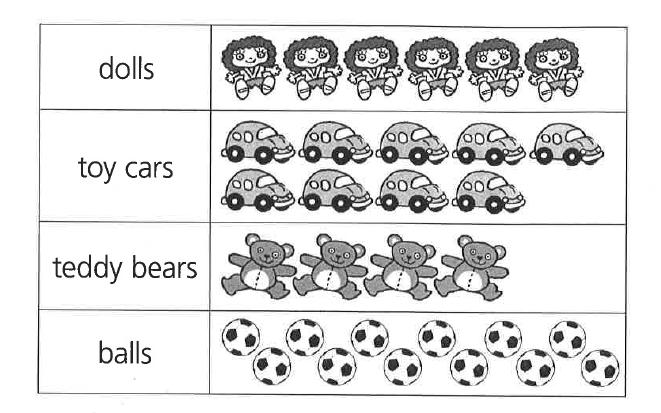
Name 2 categories.

dolls and toy cars
or any other combination
300
How many teddy bears were sold?

4
300
2 fewer teddy bears were sold than _____ .

dolls
300
What kind of graph uses tally marks?
Tally Chart
300
What type of graph is this?

A picture graph or pictograph
400
What category has the most?

soccer balls
400
How many cars were sold?
9 cars
400
_____ more cars were sold than teddy bears.

5 more cars
400
How many dolls and bears were sold?
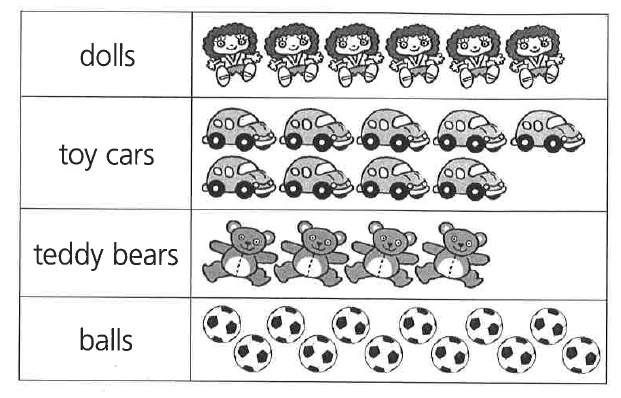
10
400
DAILY DOUBLE!!!!!!!
What is spongebob's best friend's name?
Patrick
500
Who has the fewest candies?
A. Roger B. Maria C. Clarissa D. Charles
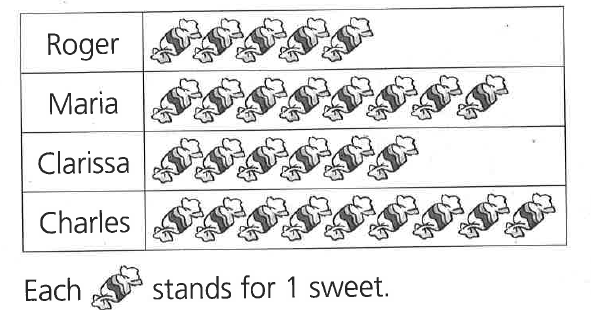
A. Roger
500
How many sweets do Charles and Clarissa have?

15 sweets altogether
500
Roger has _____ fewer sweets than Maria.

Roger has 3 fewer sweets than Maria.
500
How many sweets are there in all?

There are 28 sweets in all.
500
After this data was collected, Charles ate 2 pieces of candy. Who has the most candy now?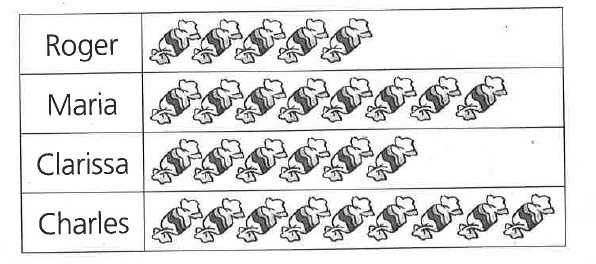
Maria