Domain
Range
Function
Scatterplot
Data Cycle
100
Domain is the _______ of a relation
x-value or x
100
Range is the _______ of a relation
y-values or y
100
A function is when...
x does NOT repeat
100
What correlation does this scatterplot have?
Positive correlation
100
What is the first step in the data cycle?
A.) Analyze Data & Communicate Results
B.) Collect or Aquire Data
C.) Formulate a Question
D.) Organize & Represent Data
C.) Formulate a Question
200
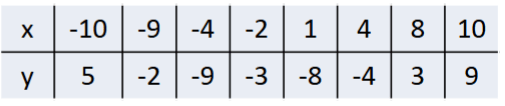
What is the domain in this function?
-10, -9, -4, -2, 1, 4, 8, 10
200
What is the range of this function?
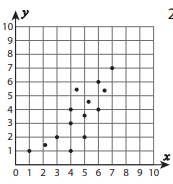
{(1,2), (2,3), (3,4), (4,5)}
2, 3, 4, 5
200
State whether the relation is a function.
{(5,4), (4,5), (3,2), (5, -1)}
It is NOT a function
200
Lincoln Bookstore records the number of customers who visit each day and the number of books sold. The scatter plot shows the data.
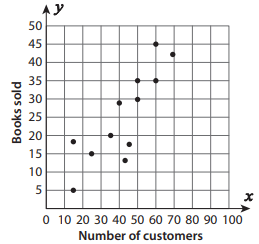
How many customers came in on the day the bookstore sold 45 books?
60 Customers
200
You can collect data in different ways, one way is watching or looking careful to gather informations which is called _________.
Observation
300
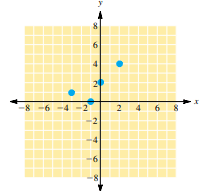
What is the domain from the following?
-5, -4, -2, 0, 2
300
What is the range from this table?
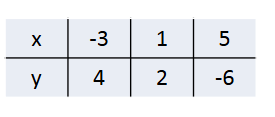
4, 2, -6
300
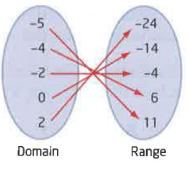
 Is this relation a function?
It is a function
300
At a community pet fair, volunteers measure the weight and height of di!erent dogs. The scatter plot shows each dog’s weight (in pounds) and height (in inches).
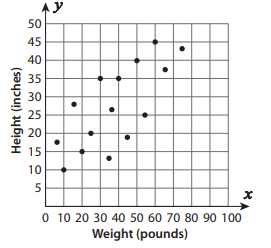
What is the height of the dog that weighs 50 pounds?
40 inches
300
What are two ways to ensure representative data?
Sample Size and Randomness
400
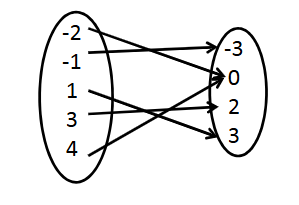
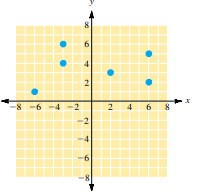
What is the domain of the following graph?
-12,-10, -6, 4, 8
400
What is the range of the following graph?

-4, 0, 2, 6
400
Is this relation a function?
It is NOT a function.
400
The graph shows the number of hours spent studying for a science exam and the final exam grade.
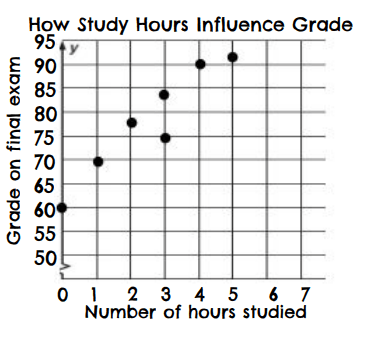
Predict the grade for a student who studied for 6 hours.
95-100
400
Which of these questions are a good statistical question?
A.) What is 7th graders favorite color?
B.) How many students love fiction books and do sports?
C.) How does the average daily temperature affect the number of ice cream sales at a local shop?
D.) What is the amount of time spent on iphone and students attitude?
C.) How does the average daily temperature affect the number of ice cream sales at a local shop?
500
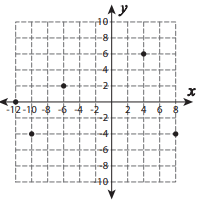
What is the domain from the graph?
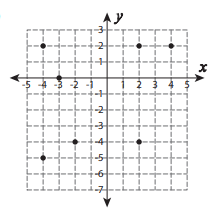
-4, -3, -2, 2, 4
500
What is the range of the following graph?

-5, -4, 0, 2
500
Is this a function?
It is a function.
500
The school counselor keeps a candy jar in her office for students. During one week, she kept count of how many students came to visit her and the number of candies in the jar, as shown in the scatter plot.
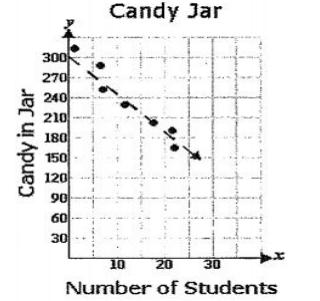
Based on the trend line, what is the best prediction for the number of candies in the jar when 30 students visit her?
between 140-130
500
What would be a good statistical question from the following?
A.) Does your dog weigh more than that wolf?
B.) How far is Egypt from Japan?
C.) Does the amount of screen time affect if you wear a jacket?
D.) Does a person's daily sodium intake correlate with their resting blood pressure level?
D.) Does a person's daily sodium intake correlate with their resting blood pressure level?