Vocabulary
Evaluating Functions
Domain & Range
Linear or Non-Linear
Is it a Function?
100
A set of input values (all values of x).
What is the definition of domain?
100
Evaluate f(2) if f(x)=-3x
f(2) = -6
100
State the domain and range:
| x | y |
| 3 | 7 |
| 5 | 9 |
| 3 | 8 |
D: {3, 5}
R: {7, 8, 9}
100
Does the table represent a linear or nonlinear function? Explain.
x: | 4 | 6 | -1 | 2 | -5 |
y: | 2 | 1 | -3 | 5 | 8 |
Nonlinear function, the rate of change is not constant.
100
Is it a function?
x: | 4 | 6 | -1 | 2 | -5 |
y: | 2 | 1 | -3 | 5 | 8 |
Yes, each input has exactly one output.
200
The set of output values (all values of y).
What is the definition of range?
200
Evaluate f(7) if f(x)= -4x -2
f(7) = -30
200
State the domain and range:
D: {1, 2, 3, 4, 5, 6}
R: {-1, 0, 1, 2, 3, 6}
200
Does the table represent a linear or nonlinear function? Explain.
x: | 3 | 6 | 9 | 12 | 15 |
y: | 2 | 1 | 0 | -1 | -2 |
Linear function, the rate of change is -1/3. x increases by 3 each time and y decreases by 1 each time.
200
Do the points (1,3), (4, 5), (2, -6), (1,5), (6, 8) represent a function?
No, the input of 1 has two different outputs 3 and 5.
300
A relationship between input and output values. Each input has exactly one output value.
What is the definition of a function?
300
Evaluate f(-6) if f(x)=2x - 9
f(-6) = -21
300
***DOUBLE JEOPARDY***
State the domain of this function?
Bonus: What is the range of this function?
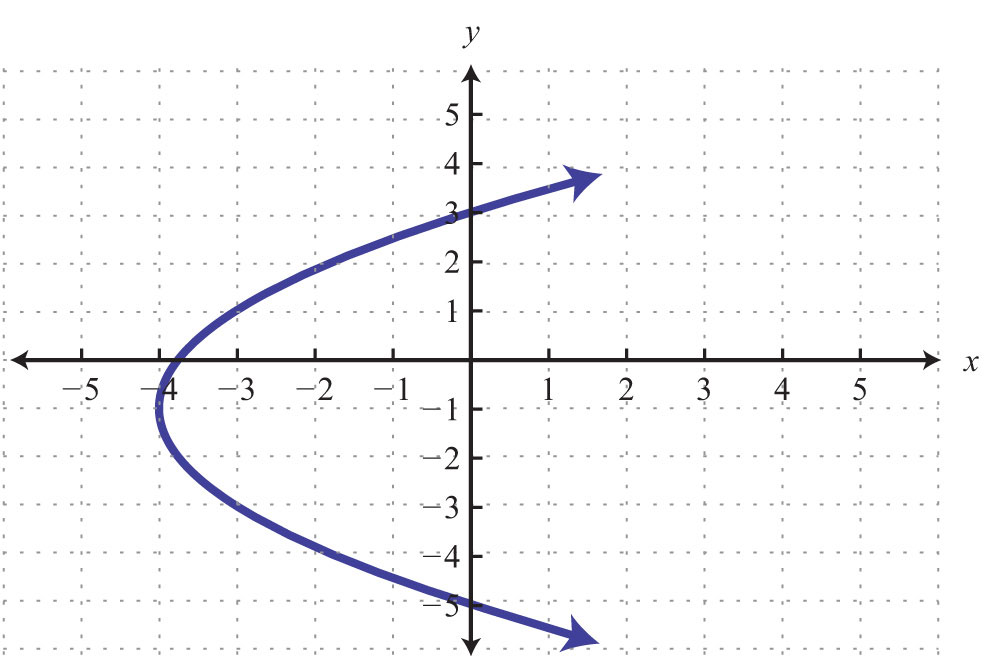
Domain: -4 ≤ x
Range: y∈ℝ or all real numbers
300
Does the set of points represent a linear or nonlinear function? Explain.
(5, 15), (6, 12), (7, 6)
Nonlinear function, the x values have a constant rate of +1 but the y values do not have a constant value, -3 and then -6.
300
Is it a function? Justify your answer.
| x | y |
| 2 | 4 |
| 1 | 5 |
| 2 | 6 |
No, the input of 2 has two different outputs.
400
A variable whose values affect the values of another variable (dependent variable). It is usually found on the x-axis of a graph.
What is the definition of an independent variable?
400
Evaluate f(x)= 9 if f(x) = 25 - 4x
x = 4
400
Draw a graph with a range that is -2 ≤ y ≤ 4
See graph.
400
Does the set of points represent a linear or nonlinear function? Explain.
(-3, 5), (2, -1), (7, -7)
Linear function, the rate of change is -6/5. The x values increase by 5 and the y values decrease by 6.
400
Is it a function? Justify your answer.
Yes, it passes the Vertical Line Test.
500
What is the test to tell if a graph is a function?
What is the Vertical Line Test?
500
Evaluate f(x)= -15 if f(x)= -3x +15
x = 10 or f(10) = -15
500
Draw a graph where the domain is -3 ≤ x < 5 and range is 2 ≤ y ≤ 6
See graph.
500
***DOUBLE JEOPARDY***
Does the table represent a linear or nonlinear function? Explain.
x: | -1 | 3 | 7 | 9 |
y: | 8 | 2 | -4 | -7 |
Linear function, the rate of change is -3/2. The x values increase by 4 and then by 2, and the y values decrease by 6 and then by 3 so still by the same rate.
500
Is it a function? Justify your answer. 
Yes, each input has exactly one output.