Miscellaneous
Is it a Function?
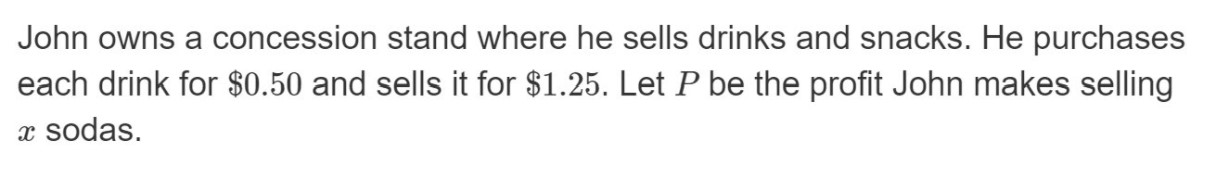
Writing and Interpreting Functions
Key Features of Graphs
Lines of Best Fit and Correlation Coefficients
Average Rate of Change
100
Which relationship represents causation?
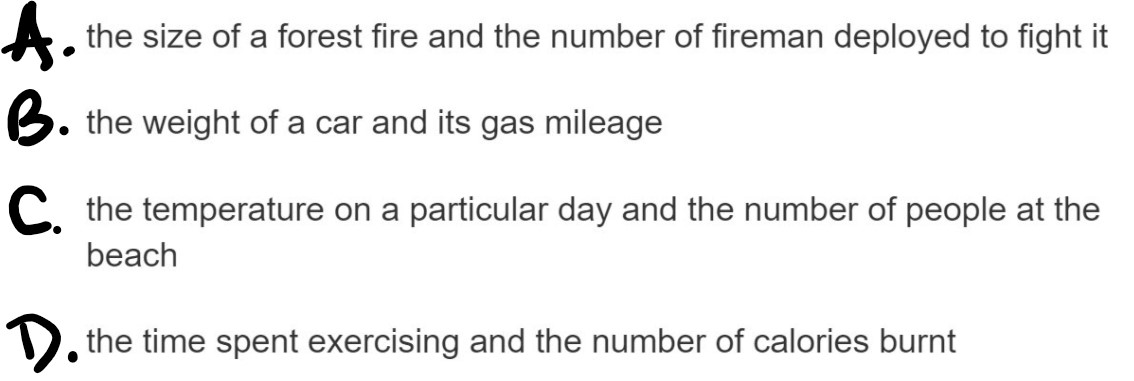
D
100
Which of these relations represent functions?
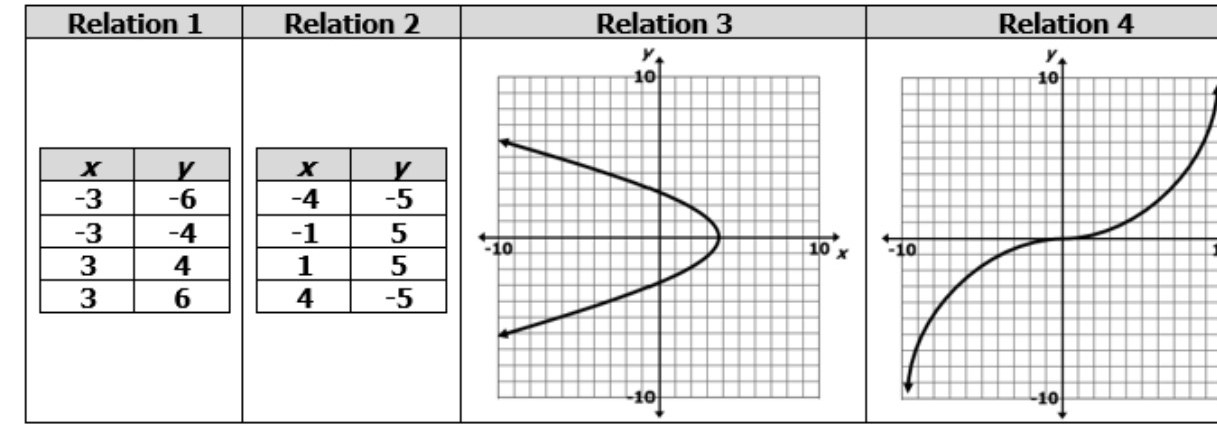
Relations 2 and 4
100
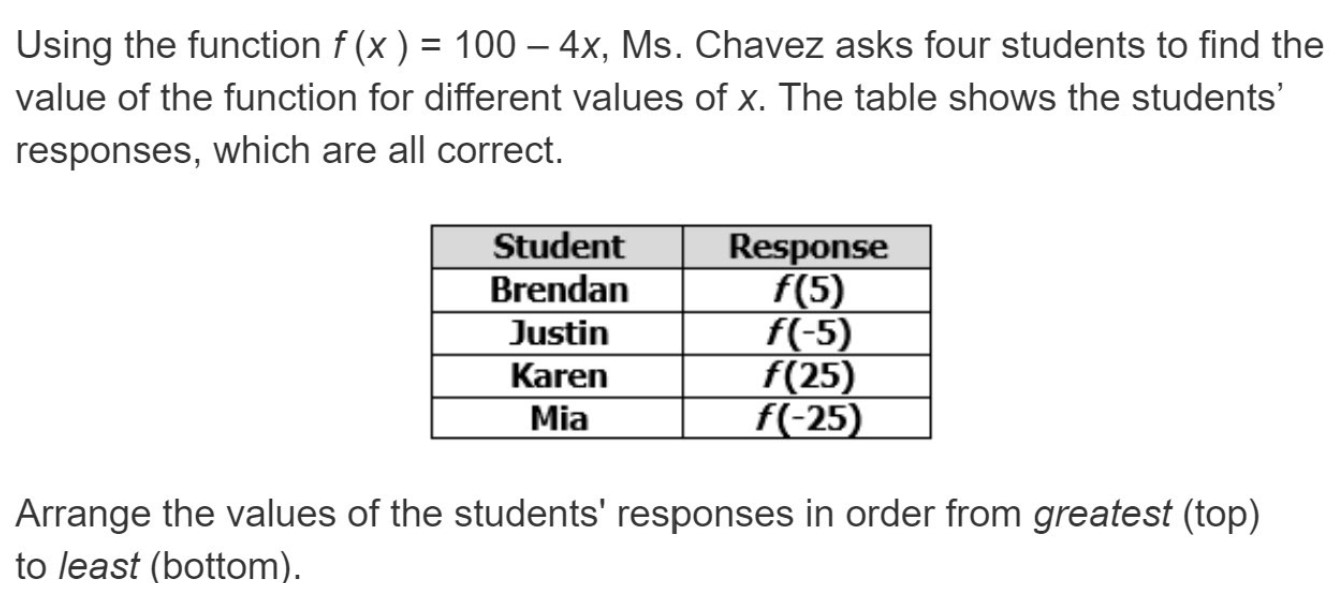
Mia, Justin, Brendan, and Karen
100
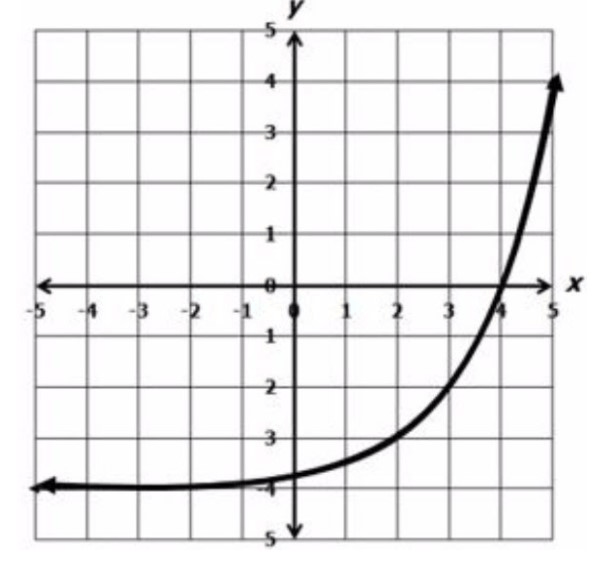
Which term BEST describes this function?
A. constant
B. decreasing
C. increasing
D. symmetric
C
100
Which scenario represents a POSITIVE correlation AND causation?
A. As the hours increase, the number of tables seated at a restaurant decreases.
B. As the number of milkshakes ordered increases, the score of the basketball game increases.
C. As the temperature decreases, the number of sleds purchased increases.
D. As the attendance to a concert increases, the total ticket sales increases.
D
100
What is the average rate of change of the function from x=1 to x=3?
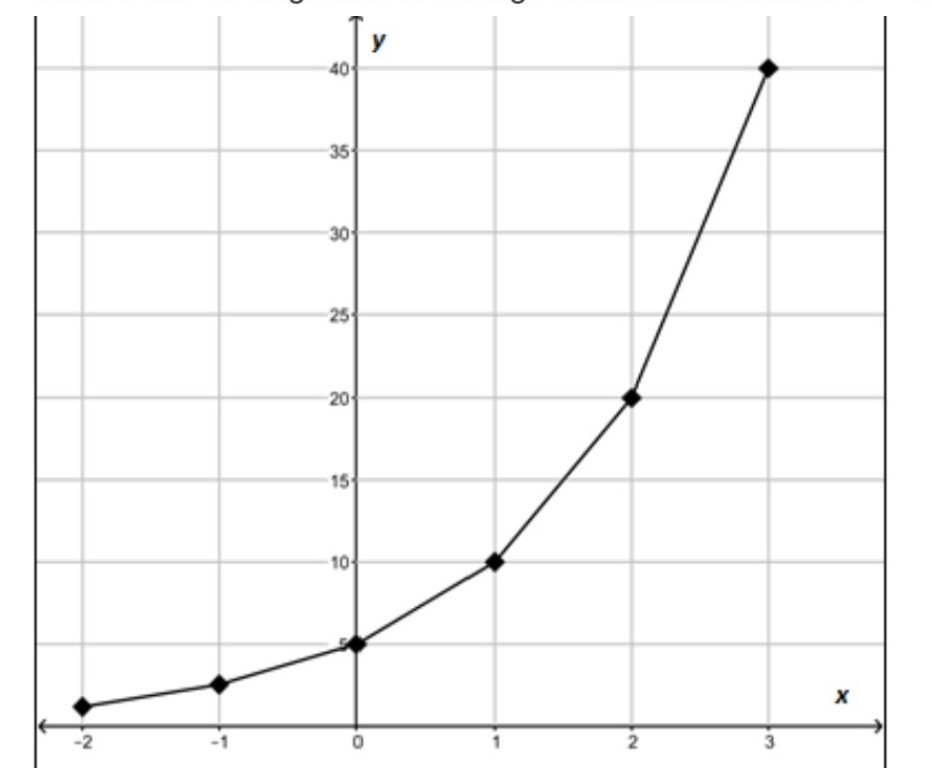
A. 10
B. 12.5
C. 15
D. 30
C
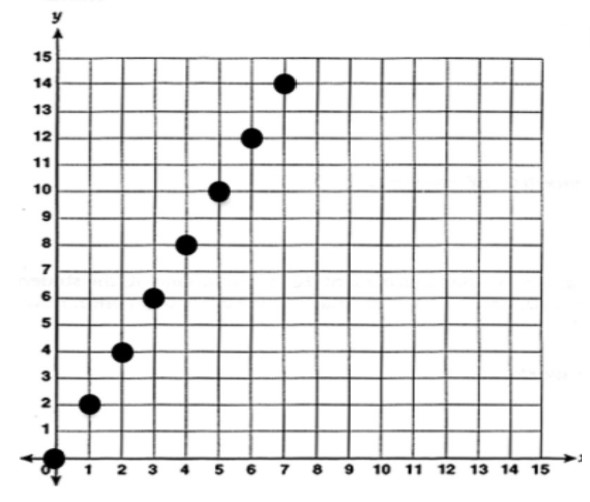
200
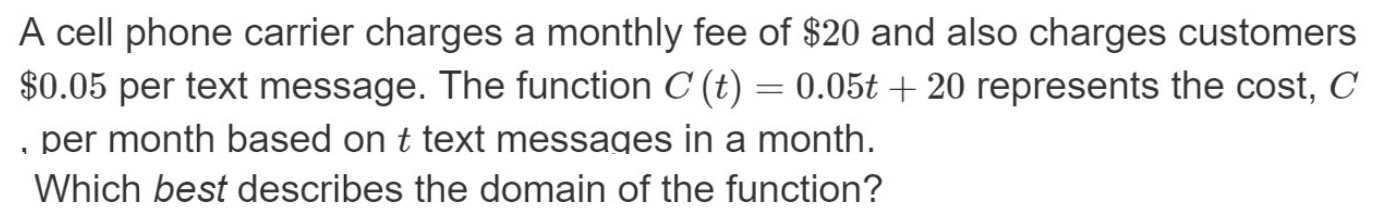
A. all real numbers
B. all real numbers that are multiples of 0.05
C. all whole numbers
D. all whole numbers from 0 to 20
C
200
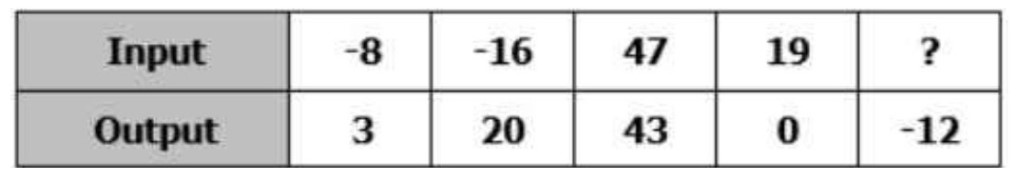
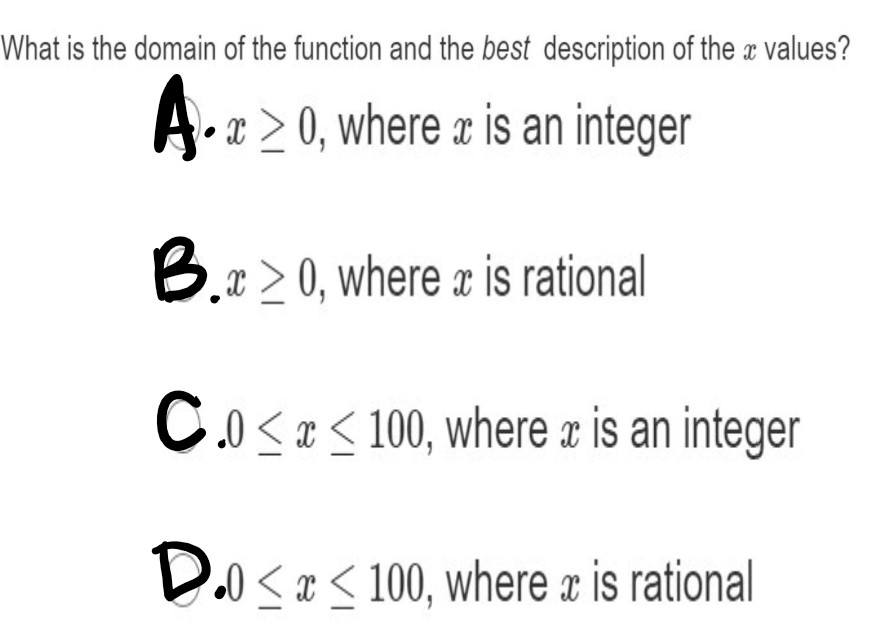
Which of the following numbers could be placed in the empty cell and still have a function?
a. -16, -12, 0, 19
b. -12, 0, 20, 43
c. -16, -8, 19, 47
d. -16, 20, 43, 47
b
200
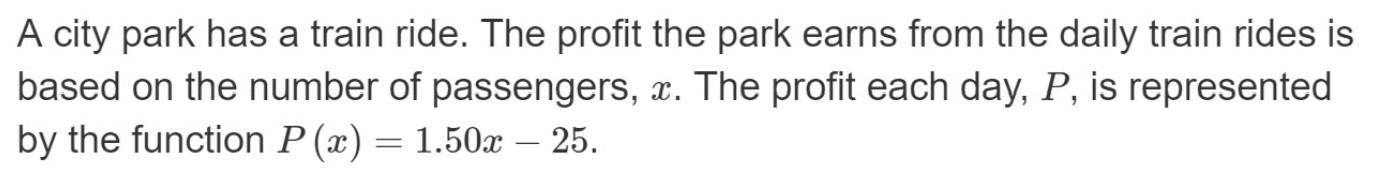 P(20) would represent the profit earned based on
A. 5 days of operating the train
B. 5 passengers riding on the train
C. 20 days of operating the train
D. 20 passengers riding on the train
and
What would be the profit if x was 20?
D and $5
200
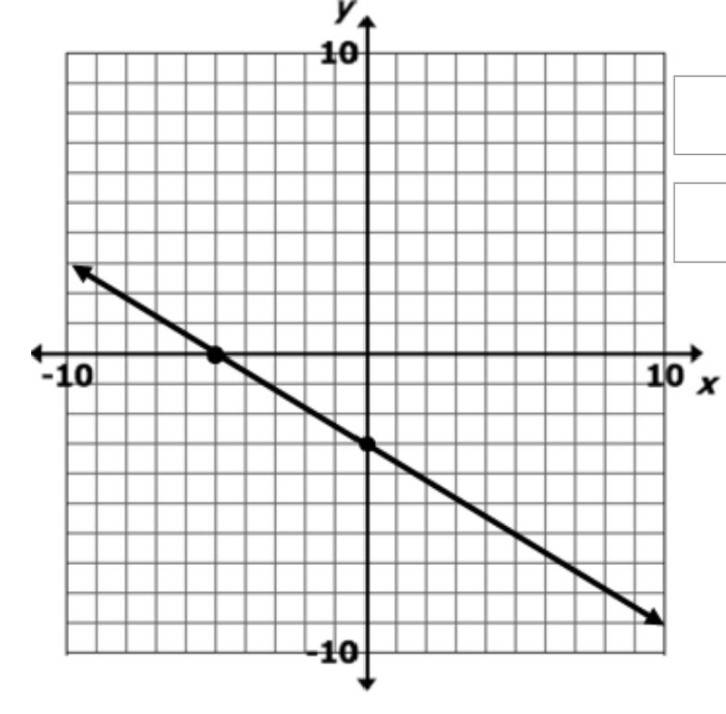
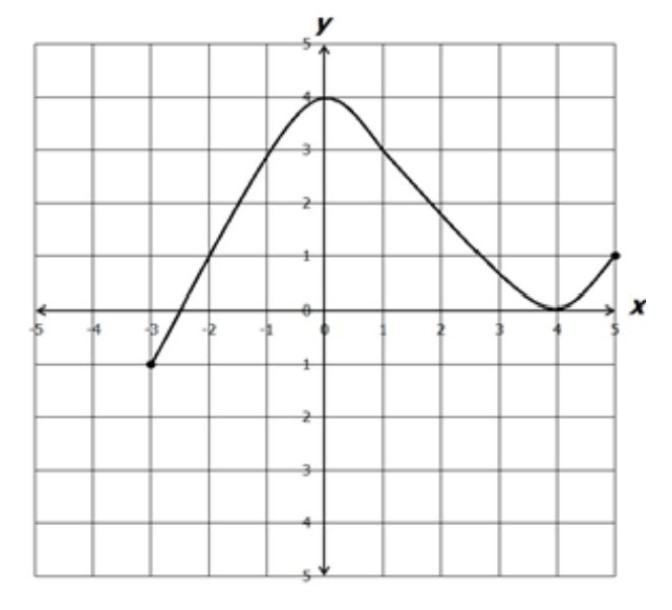
Match each coordinate to the correct part of the graph. Answers may be used more than once or not at all.
A. x-intercept 1. (-3,0)
B. y-intercept 2. (-5,0)
3. (0,-5)
4. (0,-3)
A - 2
B - 4
200
The graph shows the total number of library members at the end of every month for the year 2016.
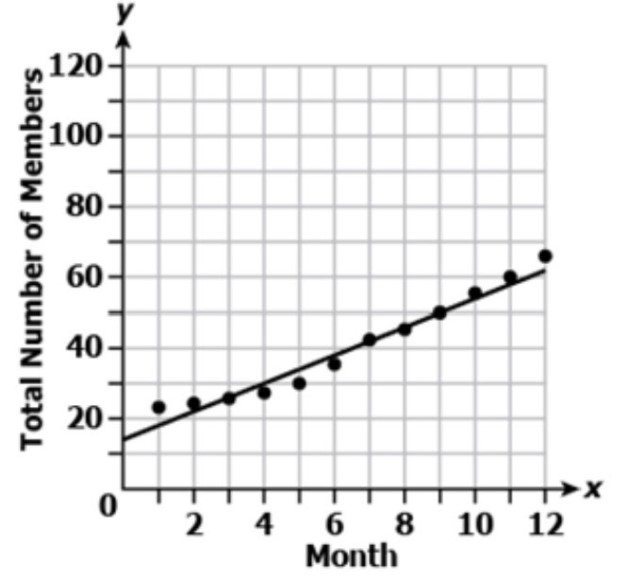
The equation for the line of best fit is y=4x+14 where y is the total number of library members after x months from the beginning of 2016. Which statement interprets the slope of the line-of-best-fit correctly?
A. the rate of change is 1 new registration every 4 months
B. the rate of change is 4 new registrations every 4 months
C. the rate of change is 4 new registrations every month
D. the rate of change is 14 new registrations every month.
C
200
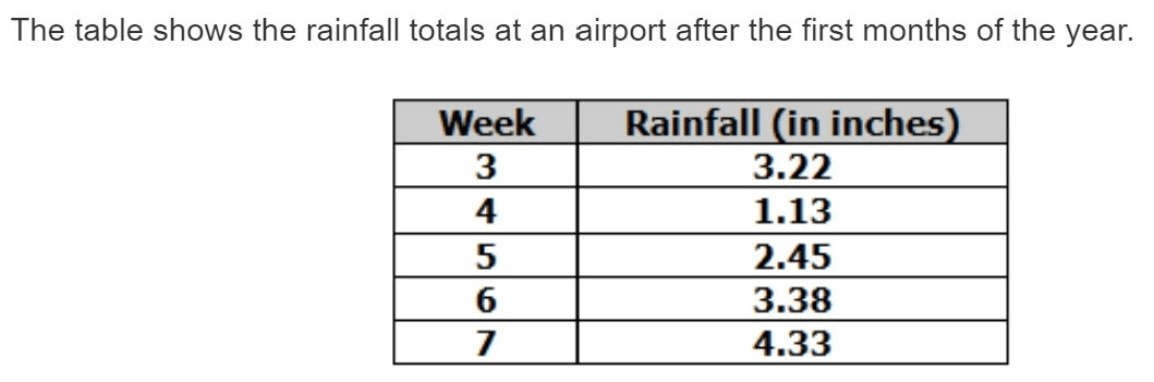
What is the average rate of change of the rainfall from Week 3 to Week 7?
A. 0.2775 inches per week
B. 1.11 inches per week
C. 1.8875 inches per week
D. 3.775 inches per week
A
300
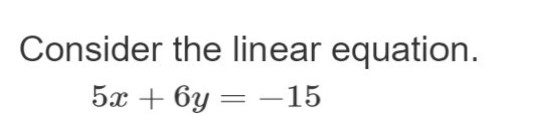
Which TWO points represent solutions to the equation?
A. (-3,30)
B. (-1, -5/3)
C. (0, -5/2)
D. (3,5)
E. (5, 10/3)
B and C
300
Does the relationship between P and x describe a function? Explain why or why not.
a. No. There is only 1 value of P for each value of x
b. No. There is more than 1 value of P for each value of x
c. Yes. There is only 1 value of P for each value of x
d. Yes. There is more than 1 value of P for each value of x
C
300
Miranda cuts grass (g) for $20 an hour and trims hedges (h) for $25 an hour. She is trying to make enough money during the summer to buy a car for $4200. Which inequality represents the number of hours Miranda needs to cut grass and trim hedges?
A.
25g + 20h >= 4200
B.
25g + 20h <= 4200
C.
20g + 25h <= 4200
D.
20g + 24h >= 4200
D
300
Which TWO values are included in the domain?
A. -4.5
B. -1
C. 0
D. 1.5
E. 5
A and C
300
The data in a linear model have a correlation coefficient of -0.92. What can be concluded regarding the data?
A. the data have a weak nonlinear association
B. the data have a strong nonlinear association
C. the data have a negative linear association
D. the data have a positive linear association
C
300
An equation representing the cost of renting a truck each day is 40 + 25d = T. Let d represent the day the truck is rented and let T represent the total cost of renting the truck.
Use the equation to match the questions (Letters) to their answers (Numbers):
A. What does the 25 represent in the equation?
B. What does the 40 represent in the equation
1. the number of days the truck was rented
2. the initial cost of renting the truck
3. the daily rate of renting the truck
4. the hourly rate of renting the truck
A - 3
B - 2
400
Which coordinate(s) would be found on the graph of the line y=-3x+2? Select ALL that apply.
A. (-2,8)
B. (-1,1)
C. (0,-2)
D. (1,-1)
E. (2,4)
A and D
400
The table shows the inputs and outputs for the function f(x) = -7x - 5
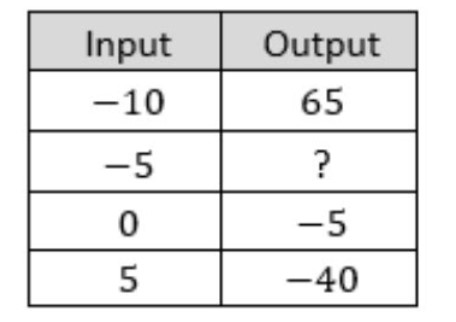
When the output is -5, what is the output?
30
400
A. 450 = m + n
B. 450 + m = n
C. 450m = n
D. 450 = mn
D
400
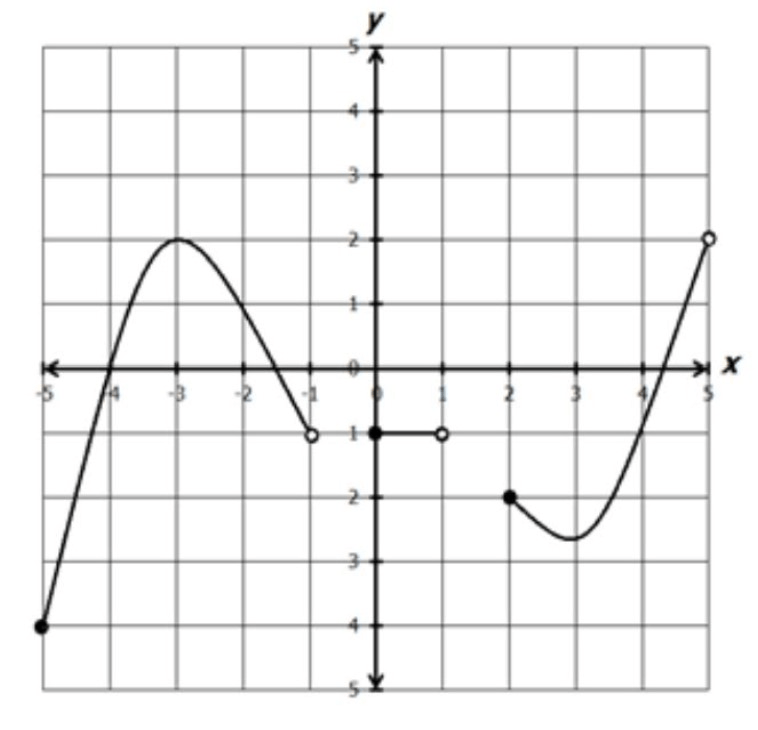
What is the domain of the function?
A. all real numbers
B. all real numbers where
-3<=x<=5
C. all real numbers where
-2<=x<=4
D. all real numbers where
-1<=x<=4
B
400
Arrange the list of values in order from WEAKEST correlation (at the top) to the STRONGEST correlation at the bottom.
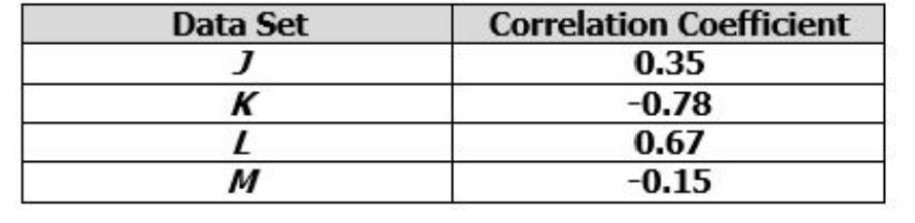
K, M, J, L
400
A boat company charges a cost per hour and a cleaning fee in order to rent a boat. Miranda rented a boat for 4 hours and paid $310. Harold rented a boat for 2 hours from the same company and paid $170.
How much does the boat company charge for the cleaning fee?
A. $30.00
B. $70.00
C. $77.50
D. $85.00
B
500
The sequence shows the total number of days Breanna used her gym membership at the the end of months 1,2,3, and 4
8, 13, 18, 23, ...
Assuming the pattern continues, which function could be used to find the total number of days Breanna used her gym membership at the end of month n?
A. f(n) = n5
B. f(n) = n + 5
C. f(n) = 5n - 3
D. f(n) = 5n + 3
D
500
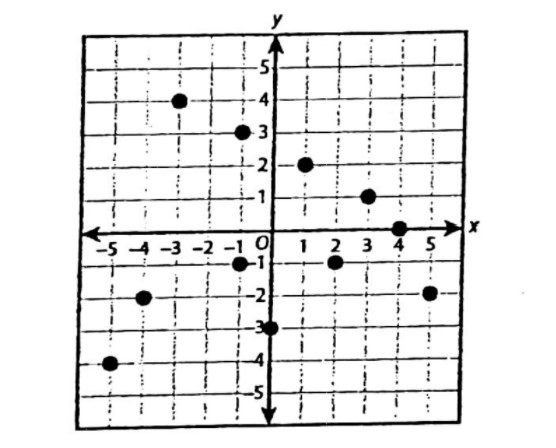
Which point can you remove from this graph to make it a function?
(-1,-1) or (-1,3)
500
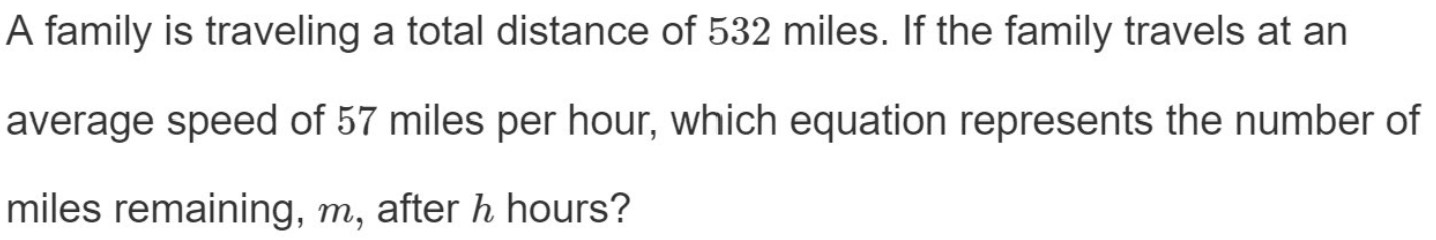
A. m = 532 - 57h
B. m = 532 + 57h
C. m = 532h - 57
D. m = 532h + 57
A
500
C
500
USE THE TI-84 on your chromebook to calculate the correlation coefficient for this table of data.
 Which value represents the correlation coefficient of this data set?
A. 0.18
B. 0.32
C. 0.43
D. 0.99
C
500
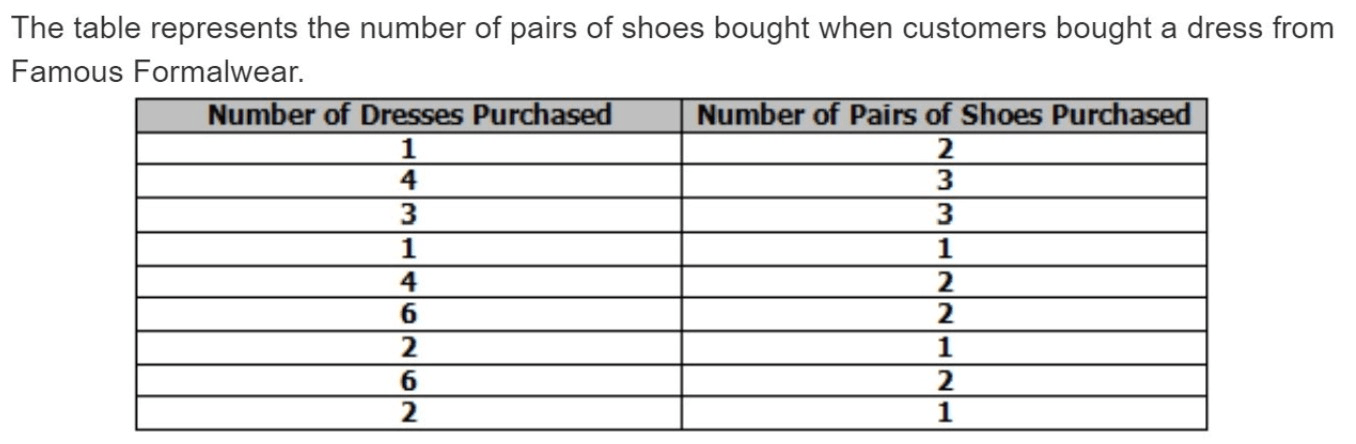
The table shows the cost of a gymnastics membership based on the number of months, n, enrolled.
Which function represents the cost of the gymnastic membership for n months?
A. C(n) = 45n + 185
B. C(n) = 45n + 230
C. C(n) = 185n + 45
D. C(n) = 230 + 45n
C
1000
What are the first five terms in the arithmetic sequence with the recursive formula below?

B
1000
Does this graph represent a function? Why or why not?

Yes because each input only has one output (it passes the vertical line test)
1000
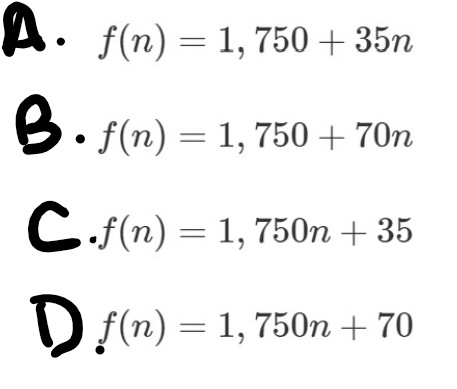
At the start of the year the balance in a married couple's account is $1,750. They decide to each deposit $35 into the account each month.
Which function represents the amount in the account n months after the beginning of the year?
1000
Consider the equation of the linear function 4x - 12y = 24. Which x- and y-intercepts and graph best represent the function?
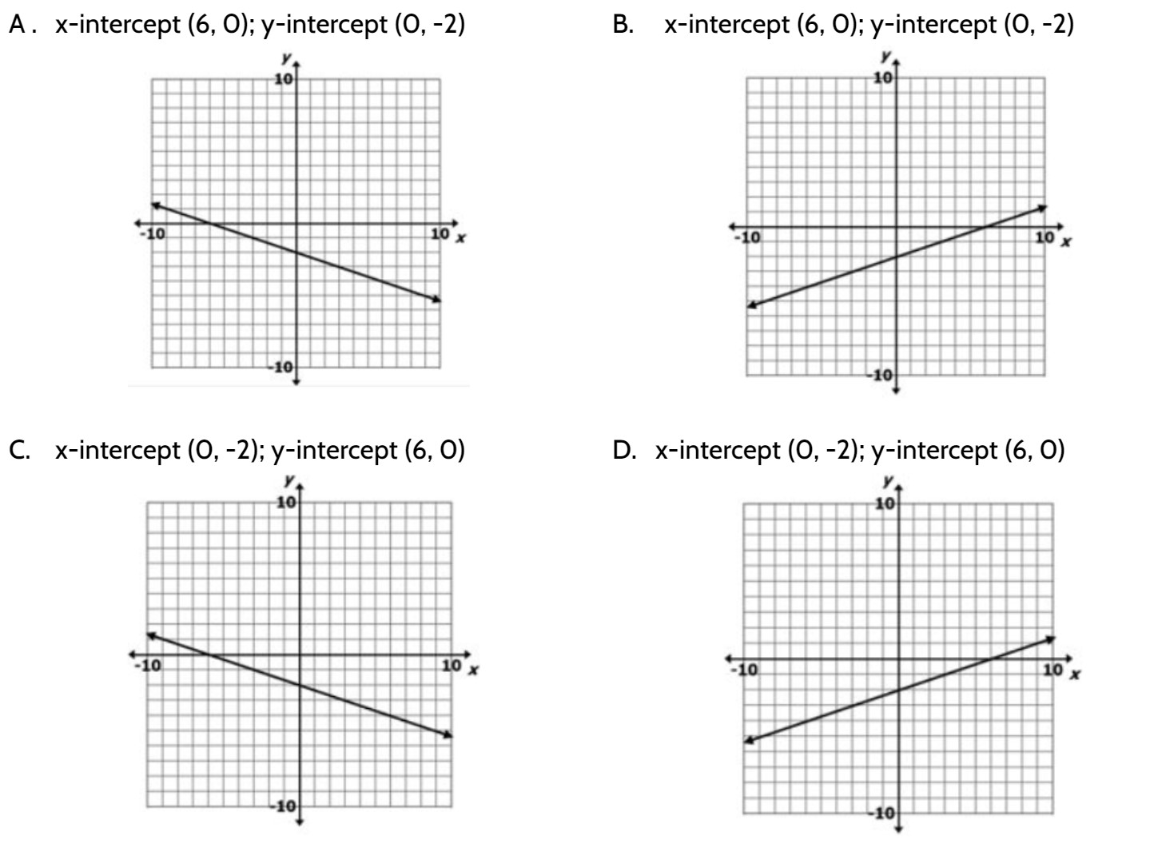
B
1000
Which best describes the relationship between correlation and causation?
A. a positive correlation between two variables always implies that a change in one variable causes a change in the other variable
B. a negative correlation between two variables always implies that a change in one variable does not cause a change in the other variable
C. a correlation between two variables does not always imply that a change in one variable causes a change in the other variable
D. there is no relationship between correlation and causation
C
1000
Dominic drives a taxi. He charges a $2 flat fee plus a rate per mile. This table represents f(x), a function that can be used to predict the total cost of any trip in Dominic's taxi.
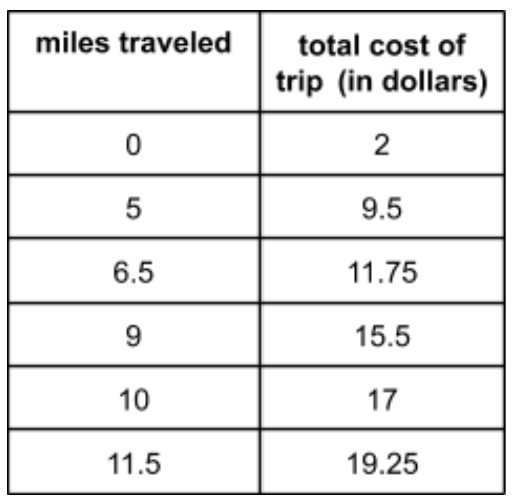
What is the rate of change and what does it represent?
A. 2 and it represents the flat fee
B. 1.5 and it represents the rate per mile
C. 1.5 and it represents the flat fee
D. 2 and it represents the rate per mile
B