Vocab
Graphing
Don't Get Confused
Throwback Thursday
100
the format for writing points like this: f(4) = 8
What is function notation?
100
The input of a function is the... (x-value or y-value?)
x-value
100
This is how many barrels of crude oil were produced in Alaska per day in 1975.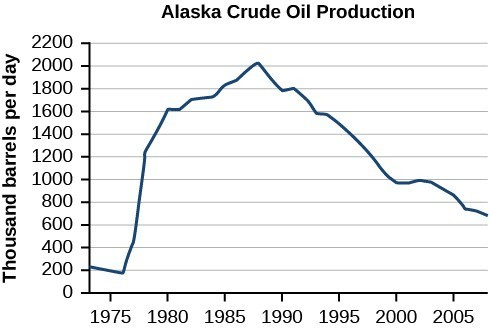
What is 200,000 gallons?
100
relationship that means there is exactly one output for each input
What is a function?
200
the set of all possible inputs
What is the domain?
200
The output of a function is the... (x-value or y-value?)
y-value
200
This is the name of the clown from IT.
Who is Pennywise?
200
a statistic that tells you the number that appears the most often in a data set
What is the mode?
300
the set of all possible outputs
What is the range?
300
This type of circle on a graph means a number is NOT included
What is an open circle?
300
These are the times when River A and River B had the same water height.
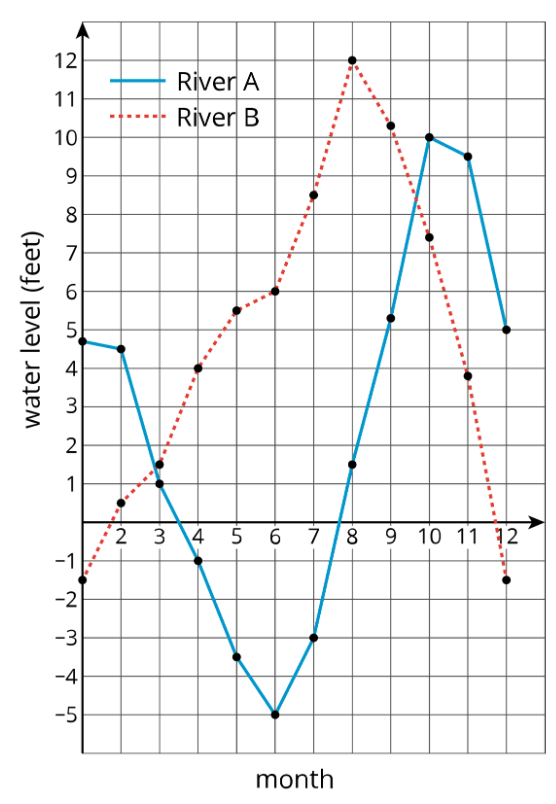
When is ~3 months AND ~9.5 months?
300
The slope-intercept formula for linear equations/graphs
y = mx + b
400
These graphs of these functions are in continuous chunks.
What are piecewise functions?
400
f(1) =
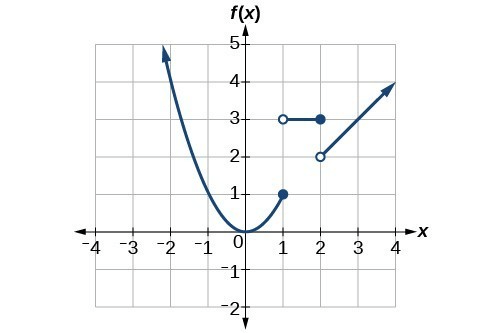
f(1) = 1
400
Is this a function?
Yes!
400
how to calculate the slope of a line
What is rise over run, change in y over change in x, climb over crawl, etc.
500
this word is the plural of "minimum"
What is "minima"?
500
f(-3) =
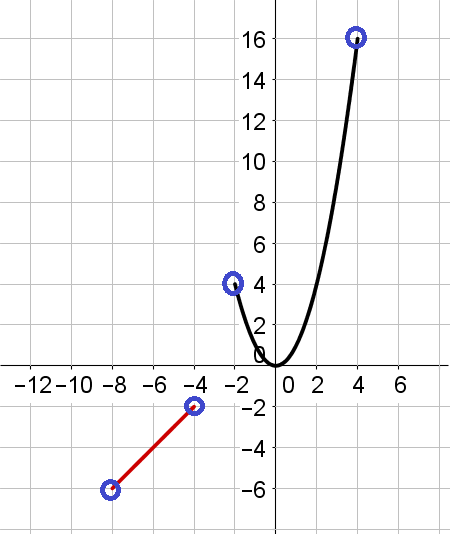
There is no output when the input is -3.
500
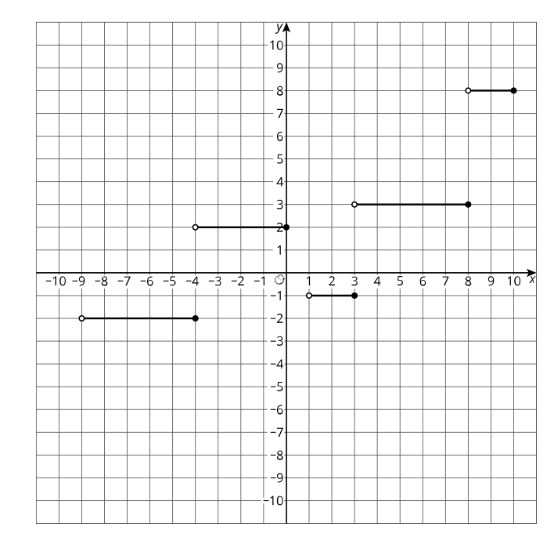
The range of this graph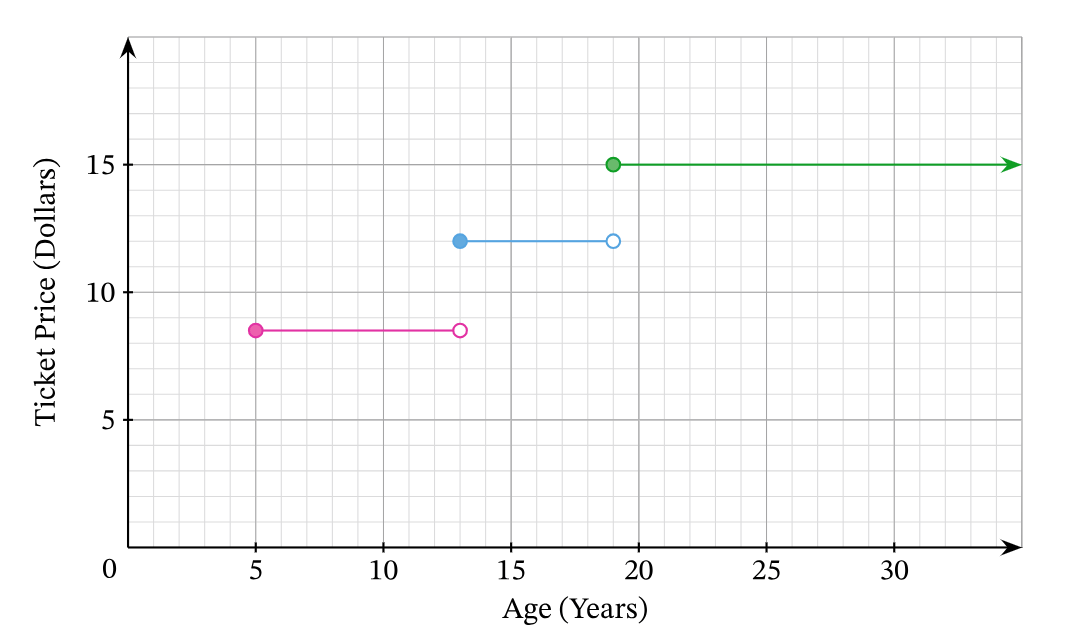
8.50, 12, 15
500
this statistic measures the variability of a data set
What is standard deviation?