Are You Having Fun(ction)?
Am I a function?
Rate of Change and Y-intercept
Key Features of Graphs
Line of a Graph
100
This word is used to describe the set of all x values for a function.
inputs
100
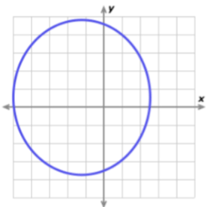
What is No, not a function? It does not pass the vertical line test.
100
What is the rate of change in the equation,
y=8x - 3
8
100
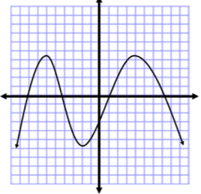
How many increasing intervals are on this graph??

1
100
What does linear mean?
Straight line
200
This word is used to describe the set of all y values of a function.
outputs
200
What is Yes?
200
What is the y intercept in the equation
y=-6x -2
-2
200
The shaded region is increasing, decreasing, or constant.
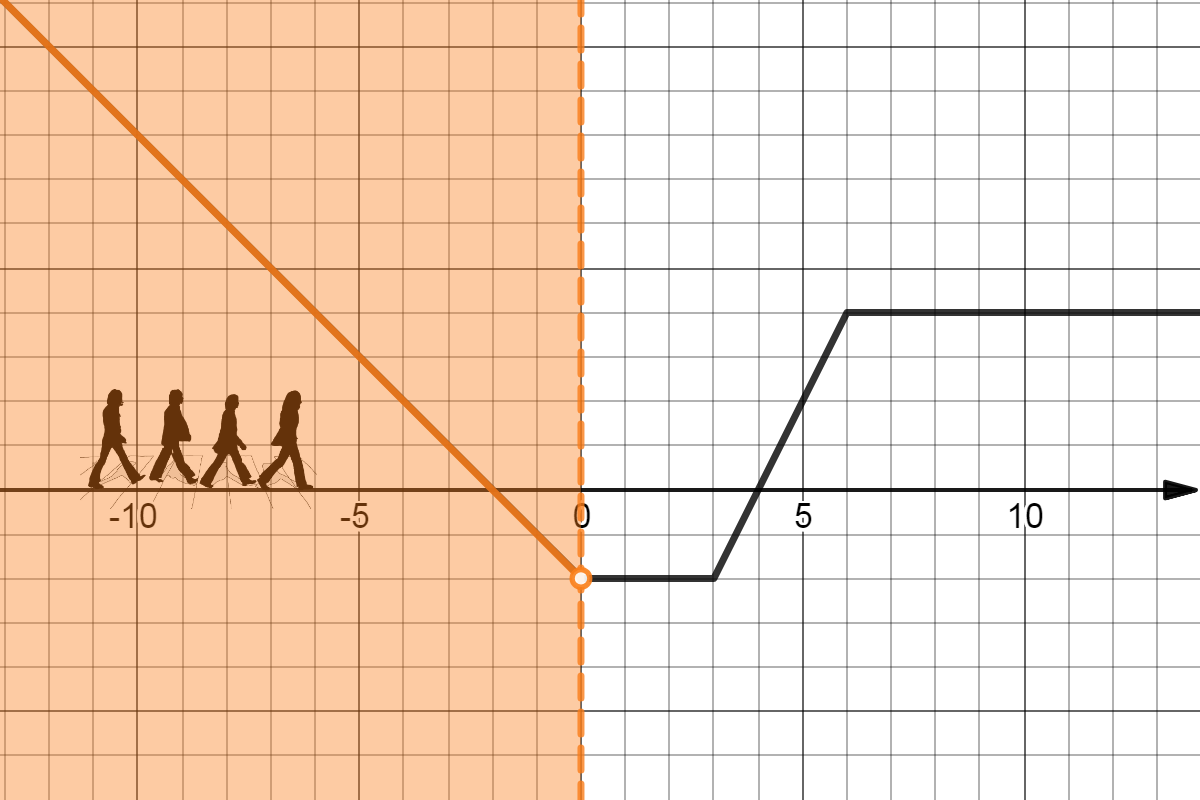
Decreasing Interval
200
What does non-linear mean?
Not a straight line
300
This word describes a relation that pairs each x value with only one y value.
What is a function?
300
The mapping diagram shows a function or not.
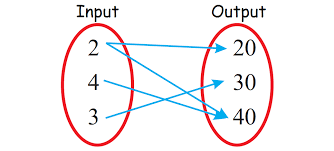
What is No, not a function?
300
What is the initial value in the equation
y= -4/3x + 2/3
2/3
300
What are the decreasing intervals of this graph?

[-6,-4]
[-2,2]
[5,6]
300
Linear or non linear?
Non-linear
400
What visual test can be used to determine if a graph is a function?
Vertical Line Test?
400
Amy claims that y=5x2-7 is a function, but not a linear function.
What supports Amy's claim.
The graph of the function does not form a straight line.
400
Find the rate of change of a line that passes through (4,5) (6,11).
3
400
What is the constant interval of this graph?
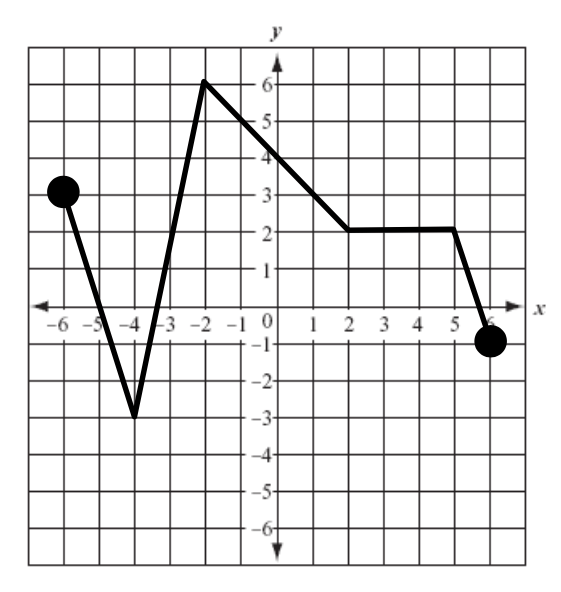
[2,5]
400
Do the points on the table display a linear or nonlinear relationship?
(0,1)
(1,2)
(2,4)
(3,8)
Non-linear