This word is used to describe the set of all x values for a function.
The input

YES! NO input values repeat.
Find the slope of the line below using rise/run.
Rise = 2
Run = 3
m=2/3
Is this linear or non-linear?
Non-linear
Without a calculator...what is 145-78?
67
This word describes a relation that pairs each x-value with only one y-value.
A function
Is this a function and why?

No, because x's repeat at 8?
What is the rate of change AND initial value of the following equation?
y = -4x - 10
Rate of Change: -4
Initial Value: -10
Linear or non-linear?

Linear
2x + y = 19
y = x + 1
(6, 7)
A function is described or expressed in these four ways.
An ordered pair, arrow diagram (or mapping), graph, and a table
This graph is not a function.
Graph 1
(3, 6) and (5, 5)
What is the rate of change between the two points?
-1/2
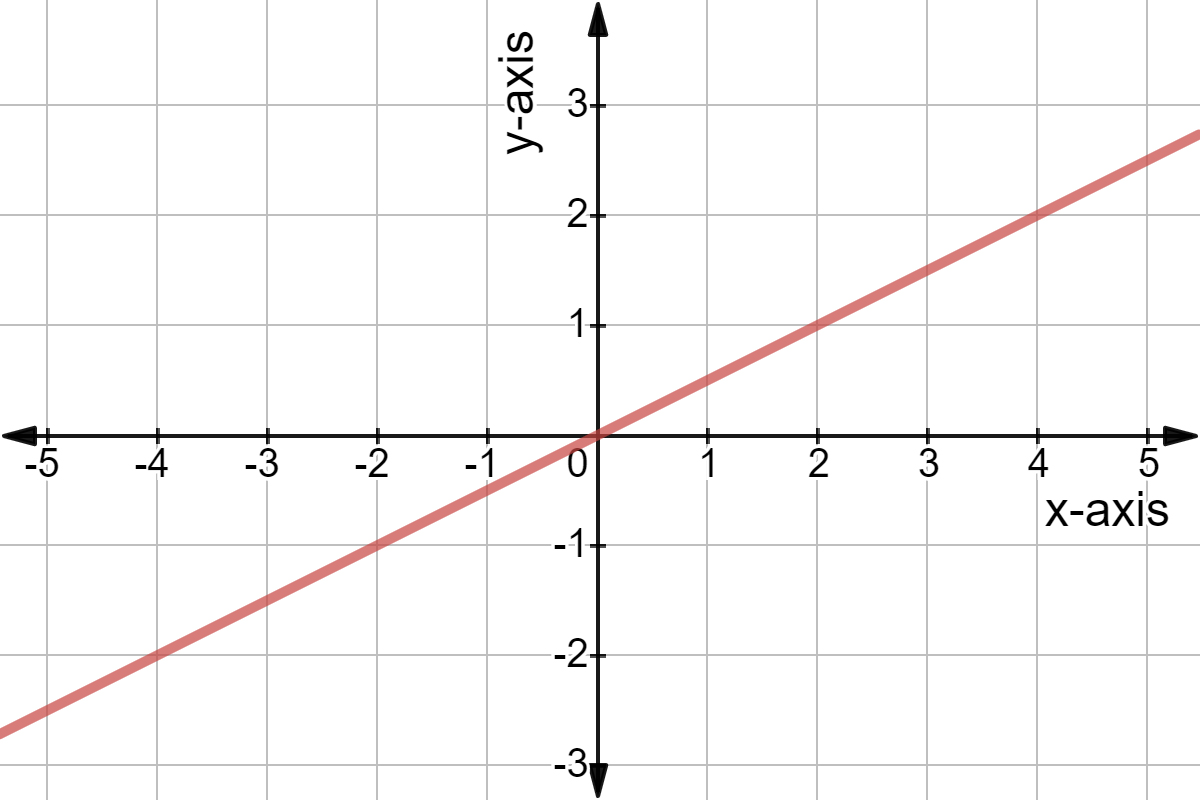
Is this linear or non-linear? If linear, what is the constant RoC?
1/2
The following ordered pair undergoes a rotation of 90 degrees clockwise. What is the new ordered pair for this point?
(6, 7)
(7, -6)
What visual test can be used to determine if a graph is a function?
Vertical Line Test
Which of the following is not a function?
a.) (0,1), (1,2), (2,3), (3,4)
b.) (0,2), (1,3), (4,3), (1,2)
c.) (1,3), (4,2), (2,0), (3,4)
d.) (1,2), (2,2), (3,2), (4,2)
B
1 can not have an output of 3 and 2

What is the rate of change?
12
Is this linear or non-linear? If linear, what is the constant RoC?

Nonlinear
5x - 62 = 3x + 20
x = 41
What graph describes a relationship with two known quantities without numbers?
Qualitative Graph
Which relation is NOT a function?
a.) (1,-5), (3,1), (-5,4), (4,-2)
b.) (2,7), (3,7), (4,7), (5,8)
c.) (1,-5), (-1,6), (1,5), (6,-3)
d.) (3,-2), (5,-6), (7,7), (8,8)
C
1 can't have a output of -5 and 5
What is the rate of change between the points (4, -3) and (-1, 3)?
- 6/5
Does the table depict a linear or non-linear function?
Non-linear
Two students are scrolling TikTok after school.
Student A has already watched 120 brainrot videos and keeps scrolling at 10 videos per minute.
Student B has already watched 60 brainrot videos and keeps scrolling for 14 videos per minute.
Who watched more videos after 10 minutes?
Student A - 220 videos after 10 minutes
Student B - 200 videos after 10 minutes
Student A watched more videos after 10 minutes!
Can a graph be nonlinear but still represent a function? Why or why not?
Yes - Think about a "V" shaped graph. This is nonlinear, but still represents a function because it passes the vertical line test (no x-values repeat).
Is (2,5), (3,6), (4, 7) and (-3,6) a function?
YES
Write an equation in slope-intercept form by finding the rate of change and initial value of the table below:

y = 3x -1
Choice _______ is an equation of a linear function:
A) y=x2 + x + 1
B) y=2x-1
C) y = (1/5)x3 + 2
B
In Fortnite, two players are running towards the safe zone.
Player A starts 200 meters away and runs at a constant speed of 5 meters per second.
Player B starts 140 meters away and runs at a constant speed of 3 meters per second.
Write a linear equation for BOTH players.
Player A: y=-5x +200
Player B: y=-3x + 140

