Are You Having Fun(ction)?
Am I a function?
Write a function rule!
To be Linear or not!
Comparing Functions and Analyzing Graphs
100
This word describes a relation that pairs every input with exactly one output.
Function
100
Is this a function? Explain how you know.
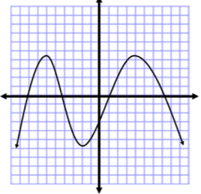
It is a function, since it passes the Vertical Line Test.
100
Write a function rule (an equation) for the following sentence. Use x for the independent variable and y for the dependent variable.
"The output is 8 more than 5 times the input."
y = 5x + 8
100
Tell whether the function is linear or nonlinear. If it is linear, find the rate of change.
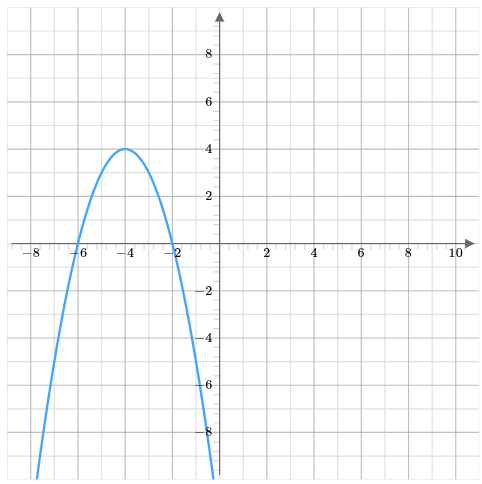
Nonlinear
100
Which has a greater rate of change:
A.
y=3x + 15
B.
y=12/3x + 4
B. 12/3=4
4 is greater than 3.
200
What visual test can be used to determine if a graph is a function?
Vertical Line Test
200
Is this a function? If yes, add a point that makes it no longer a function. If no, identify the pairs that make it NOT a function.
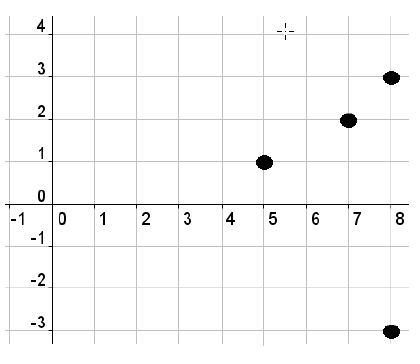
No, because x's repeat at 8. (8,3) and (8,-3)
200
Write a function rule (an equation) for the following sentence. Use x for the independent variable and y for the dependent variable.
"The output is 7 less than one third of the input."
y=1/3x-7
200
Tell whether the function is linear or nonlinear. If it is linear, find the rate of change.
Linear. The slope is -4/5.
200
Which has a greater rate of change:
A.
y=3/4x
B. 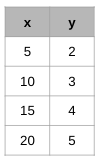
A. 3/4 is greater than 1/5
300
This is what has to remain constant in order for a function to be linear.
The rate of change / Slope (m)
300
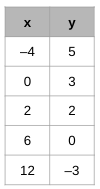
Does the following table represent a function? If yes, add a point that makes it no longer a function. If no, specify the pairs that make it NOT a function.
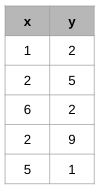
No, because the input (x) of 2 has two different outputs (y). (2, 5) and (2, 9)
300
Write an algebraic equation for the function. Use the form y = mx + b but use p and t instead of x and y.
"The price p of an ice cream is $3.95 plus $0.85 for each topping t on the ice cream."
y = 0.85x + 3.95
p = 0.85t + 3.95
300
Is the following function linear or nonlinear? How do you know?
y = x2 + x + 1
Nonlinear, since the equation cannot be written in y = mx + b form (because of the exponent).
300
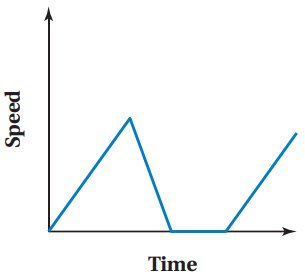
Sketch a graph that represents this situation. The horizontal axis represents "Time" and the vertical axis represents "Speed."
You gradually increase your speed, then stop at a store for a couple of minutes. You then continue to ride, gradually increasing your speed.
400
This is the term for a list of ordered pairs, where inputs are paired with outputs.
Relation
400
Is this a function? If yes, add a line that makes it no longer a function. If no, identify the pairs that make it NOT a function.
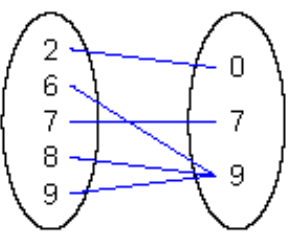
Function, every input has exactly one output.
Example: Add a line from 2 to 7 (2,7) to make it no longer a function.
400
Write an algebraic equation for the function. Use the form y = mx + b but use m and n instead of x and y.
"Jaquelyn's earnings m are a function of the number of lawns n she mows at a rate of $15 per lawn."
y = 15x + 0
m = 15n
400
Is the following function linear or nonlinear? How do you know?
y+2x=4(x-5)+11
Linear. Can be written as y = 2x - 9, which is y = mx + b form.
400
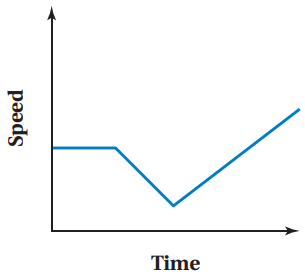
Sketch a graph that represents this situation. The horizontal axis represents "Time" and the vertical axis represents "Speed."
You ride at a constant speed, then go up a hill. Once on top of the hill, you gradually increase your speed.
500
These are the 5 ways that a function can be represented by.
Graphing
Mapping Diagram
Ordered Pairs
Table
Equation
500
Is the following a function? Explain how you know.
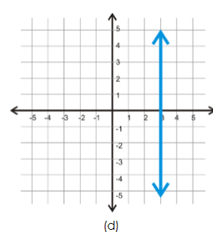
Not a function. Does not pass the Vertical Line Test (because it would intersect at every single point!).
Only non-vertical lines are functions.
500
Identify the input and output of the relationship.
"The price p of a club's membership is $30 for an enrollment fee and $12 per week w to be a member."
Input: number of weeks
Output: price of the club's membership
500
Is the function linear or nonlinear? Explain/show how you know.
Linear. The slope is constant. The slope is -1/2.
500
The graph shows the number of leaves left on a tree over time. Describe the change in the number of leaves represented by the graph.
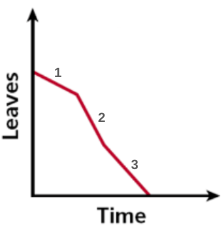
Section 1: Leaves fall off the tree at a constant rate.
Section 2: A gust of wind one day blows off many leaves at a greater constant rate.
Section 3: The leaves continue to fall off the tree at a constant rate until there are no more leaves on the tree.