Does it even matter?
(EMR and matter interactions)
(EMR and matter interactions)
Why is the sky blue? Rayleigh scattering occurs when light interacts with particles that are _____ than the wavelength of light
smaller
This type of geospatial data stores spatial information in the form of an image made up of pixels representing a single value
Raster
An array of these makes up a sensor
Detectors
This is an image from a GOES satellite, which continually collects data from the same point on Earth in this kind of orbit
Geostationary
Make one of these using the following button: 
Spectral Profile Tool
This kind of EMR, which ranges from .720 to 1.3 microns, is highly reflective in healthy vegetation
NIR
A raster is made up of two components: image data and this
Header
This type of sensor detects and records EMR emitted from the sensor itself, like LIDAR or RADAR
Active sensor
This Earth observation program is the longest running satellite continuity program, with its first launch in 1979
Landsat
What land cover type does this spectral signature represent?

Soil/barren
This part of the EMS is usually emitted from a surface, not reflected (wavelengths not needed, just the name)
Thermal infrared
To create a false color composite from Landsat imagery displays NIR-RED-GREEN in the RGB channels, use this band combination
5-4-3
In a satellite image, the total cross-track and along-track widths for the entire sensor define this characteristic
Spatial extent
This medium to coarse resolution program has a wide swath width so that it can provide daily data of the entire globe for monitoring ocean temperatures, vegetation health, land cover change and snow and ice cover.
MODIS
The SCP Plugin in QGIS converts this number to a reflectance value.
Digital number
This value is the ratio of the observed brightness reflected off of a surface to the amount of irradiance falling on it - also denoted as p(λ) = RR(λ) / RI(λ)
reflectance
A GIS can plot raster data in the correct place on Earth because of these pieces of information in the header (name two)
Top left coordinate, pixel size, CRS
A sensor that produces this spectral profile is probably in this spectral resolution category
Hyperspectral
On a satellite's elliptical orbit, this is the point the satellite is closest to earth
Perigee
This file extension is how QGIS default saves projects and data
.gpkg
Shown here, the relationship between temperature of a blackbody, emitted radiation and wavelength is known as this law
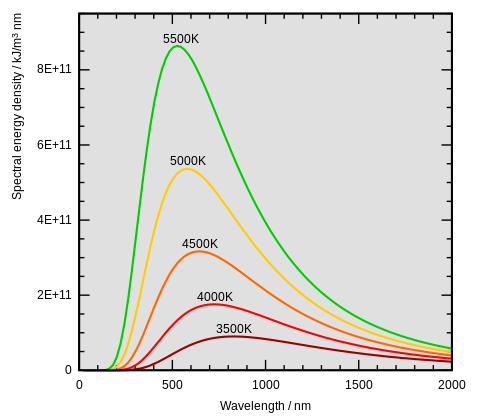
Wien's displacement law
This is how multi-band imagery is digitally organized into a single file
Interleave
This part of the sensor response curve, covered by the red box, is above the maximum of the sensor's dynamic range
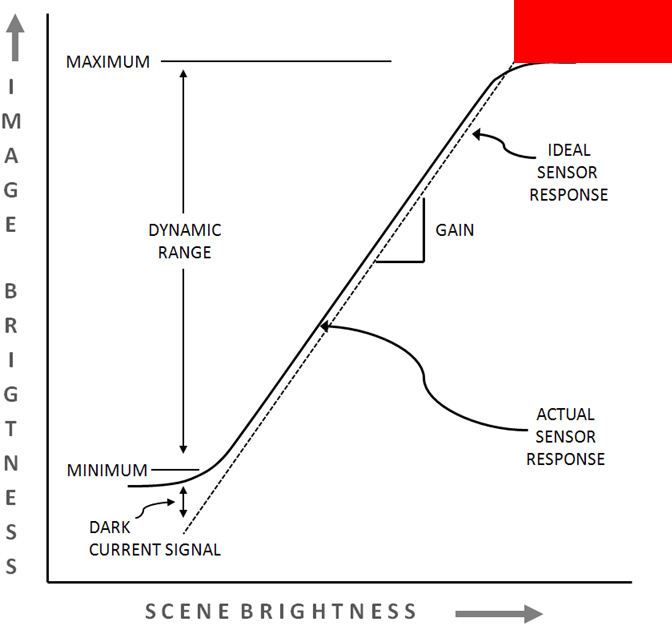
Saturation
This spaceborne-LIDAR system recently went through a test mission aboard the ISS, and captures near-global canopy information in full waveform format
GEDI
Oops! What's happening on the left is likely this kind of error(
Projection
This type of surface is a perfect isotropic reflector
Lambertian
This is the maximum value that can be stored in an 8-bit unsigned integer raster
255
One way sensors differentiate specific wavelengths is by using filters. This second type is more often used in hyperspectral sensors
Diffraction grating
This image is from this satellite program, which has 10 bands in the shortwave to thermal infrared range:
ASTER
Like QGIS, this is another example of an open source GIS platform
GRASS R Python GDAL etc
