Falling
Blob
Graphs
1
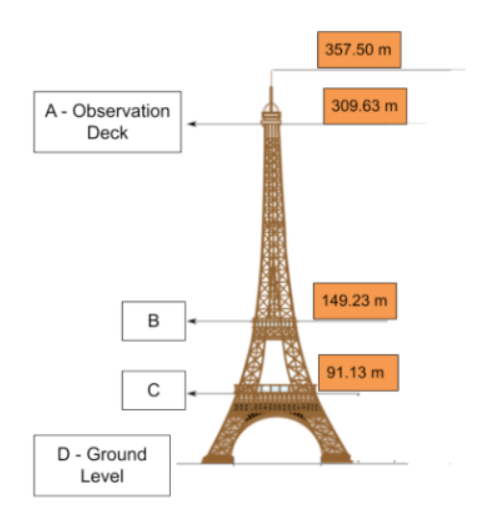
Which position in the diagram would result in the most potential energy for a falling object?
A - Observation Deck
1
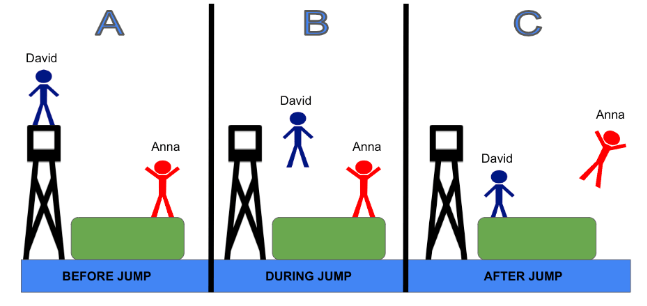
Whose Energy is transferred to the airbag?
David's
1

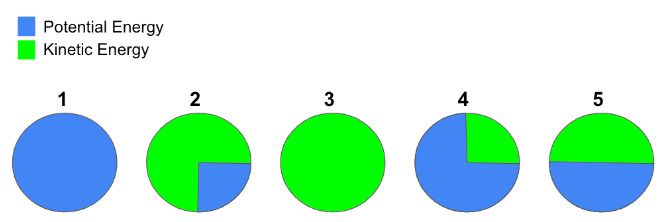
If something is dropped from the observation deck, which pie chart most accurately represents the pie chart when that object reaches level C in its fall?
2
2

Put the levels in order from LEAST potential energy to MOST Potential energy if something were dropped off the Eiffel Tower.
D, C, B, A
2

Describe the change in David's energy as he jumps from the platform.
His potential energy decreases as his Kinetic energy increases
2
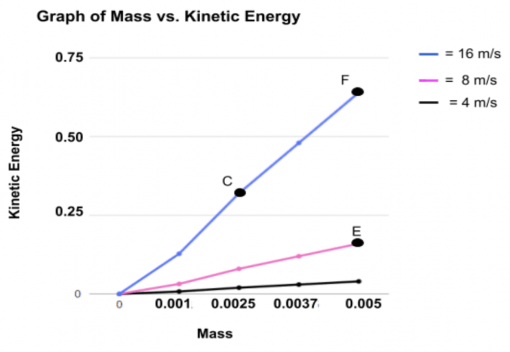
Which labeled point on the graph represents an object that would cause the most damage to a stationary object?
F
3
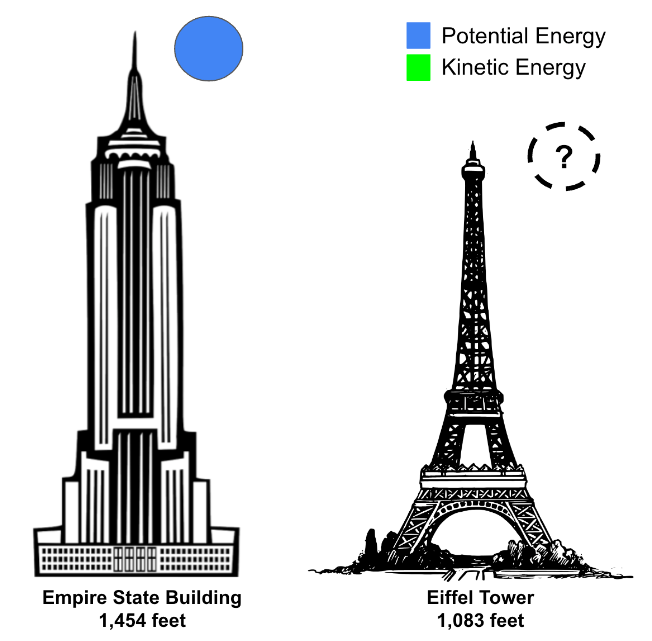
Describe how the pie chart would change from the Empire State building to the Eiffel Tower.
1- All blue
2- Smaller
3
How do we know when kinetic energy is being transferred between objects?
There is a change in motion in both objects.
3

What type of relationship exists between mass and kinetic energy?
Proportional*
As mass goes up, the KE goes up.
4

Describe all of the energy transfers happening throughout the picture.
1- David's PE -> KE
2- The blob transfers David's KE into Anna
3- Anna absorbs KE from blob
4- Anna's KE -> PE
*5- Anna's PE -> KE
4
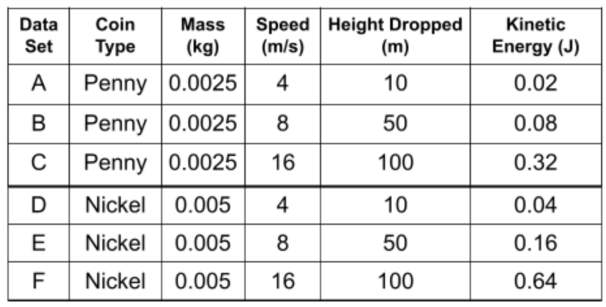
The Kinetic energy gets two times bigger because the ____________ gets two times bigger.
Mass