Sampling Techniques
Qualitative vs. Quantitative
Frequency Tables
Graphs
RANDOM
100
What is the difference between a population and a sample?
Population: entire group of people being studied
Sample: part of the population
100
What is the difference between quantitative and qualitative data? Provide an example of each.
Quantitative: numerical data (counting or measuring)
Qualitative: non-numerical data (can be organized in categories)
100
Calculate the fraction for the relative frequency of chocolate.
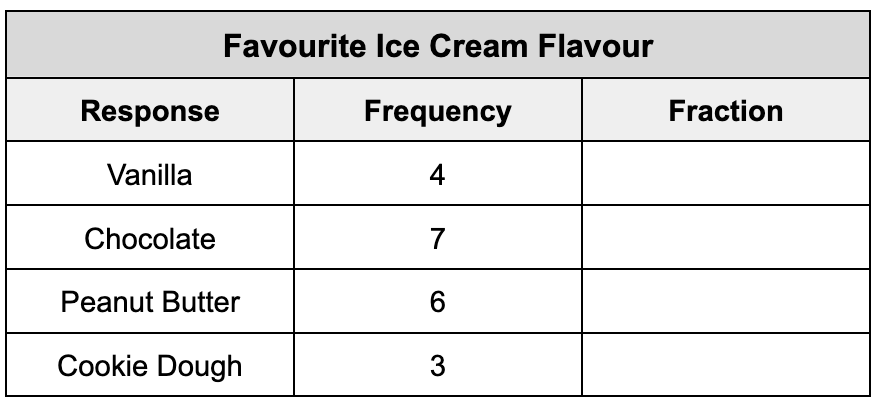
Chocolate:
7/20
100
Is a bar graph a good choice for displaying this data? Why or why not?
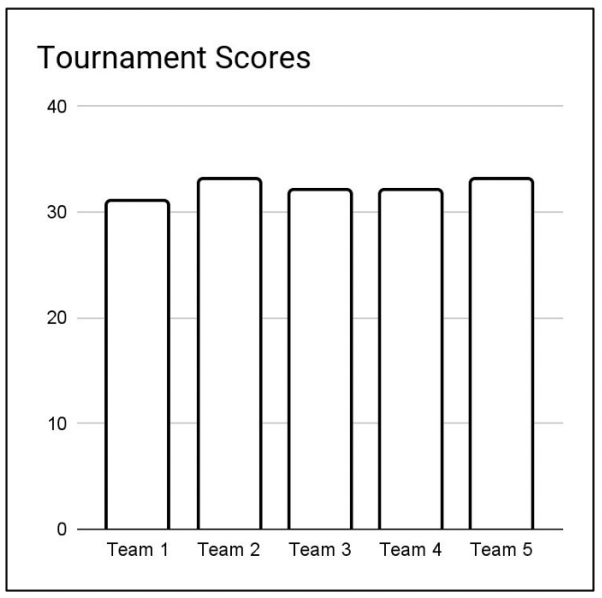
No because the data has small differences that are hard to read in a bar graph.
100
What is 100 + 100?
200
200
Identify the type of sampling technique:
A newspaper randomly sends a survey to readers who are 50+ years old.
Stratified Random Sampling
(involves dividing the population into groups and randomly selecting people from groups)
200
Is the following data quantitative or qualitative?
Test Scores:
58%,60%, 77%, 80%, 81%, 95%,
Quantitative (numerical)
200
Calculate the decimal for the relative frequency of swimming.
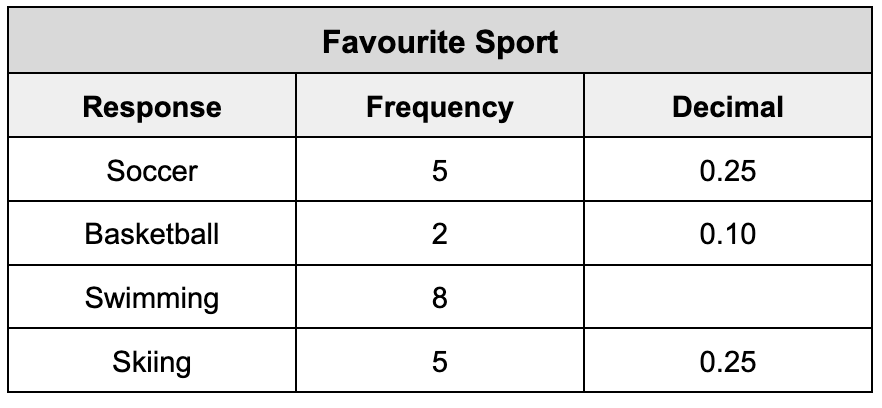
Swimming: 0.40
200
What do you notice from this graph?
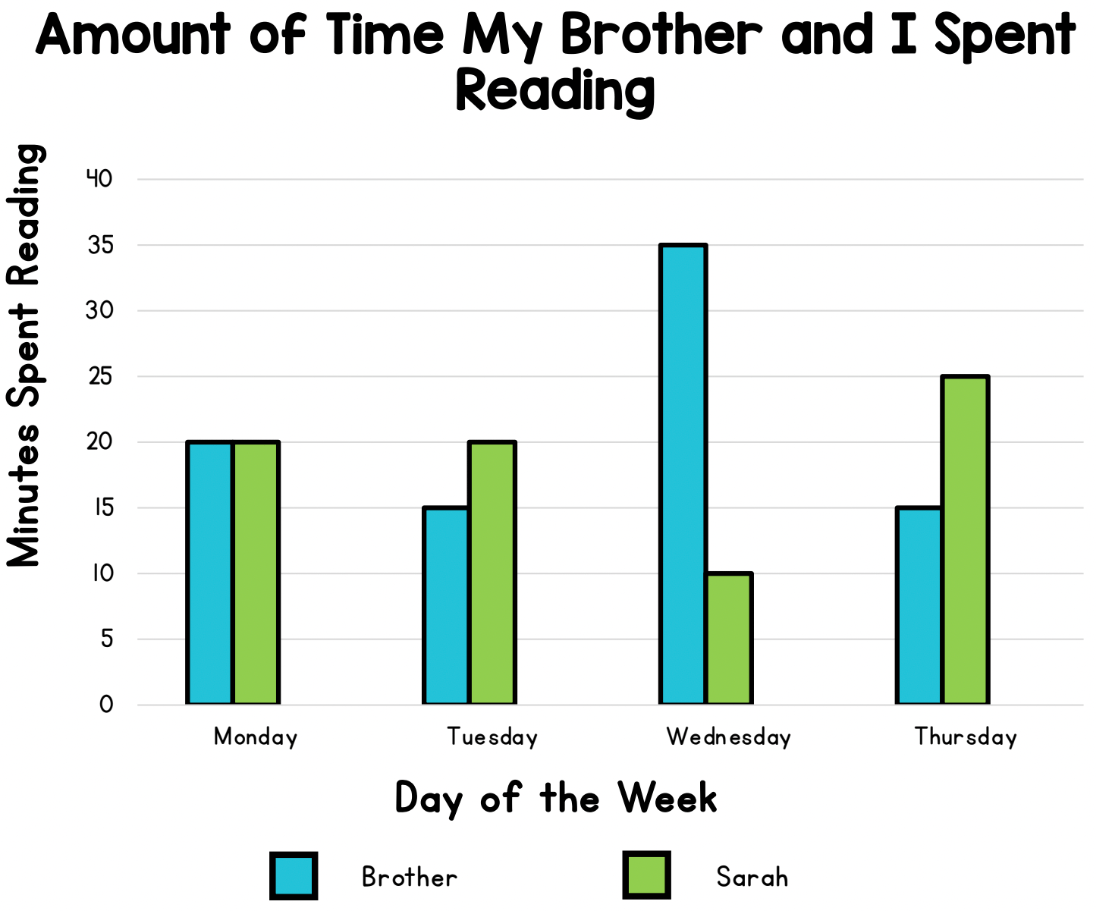
- Spend same amount of time reading on Mondays
- Brother spends significantly more time reading on Wednesdays
- Sarah reads more on Tuesdays and Thursdays
200
How many eggs are in a dozen?
12
300
Identify the type of sampling technique:
A teacher interviews every 5th student who walks into class.
Systematic Random Sampling
(involves randomly choosing students at a fixed interval)
300
Is the following data quantitative or qualitative?
Favourite Chocolate Bar:
Kit Kat, Hersheys, Smarties, Coffee Crisp
Qualitative: non-numerical (categories)
300
Calculate the percentage for the relative frequency of dogs.
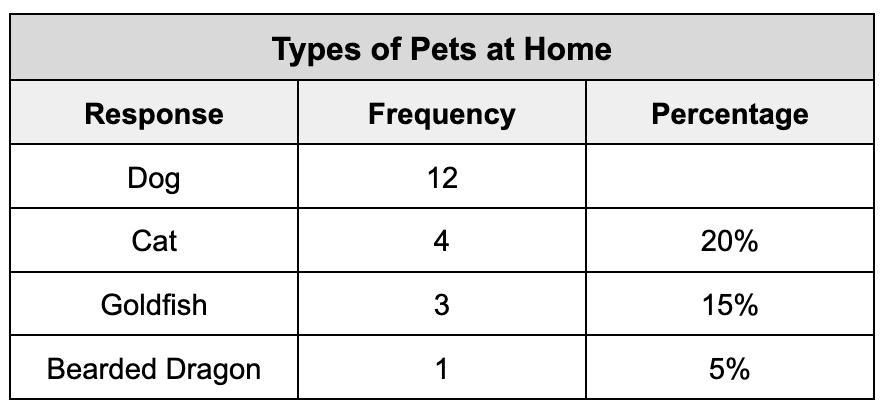
Dog: 60%
300
How many more students chose a dog as their favourite pet than a hamster?
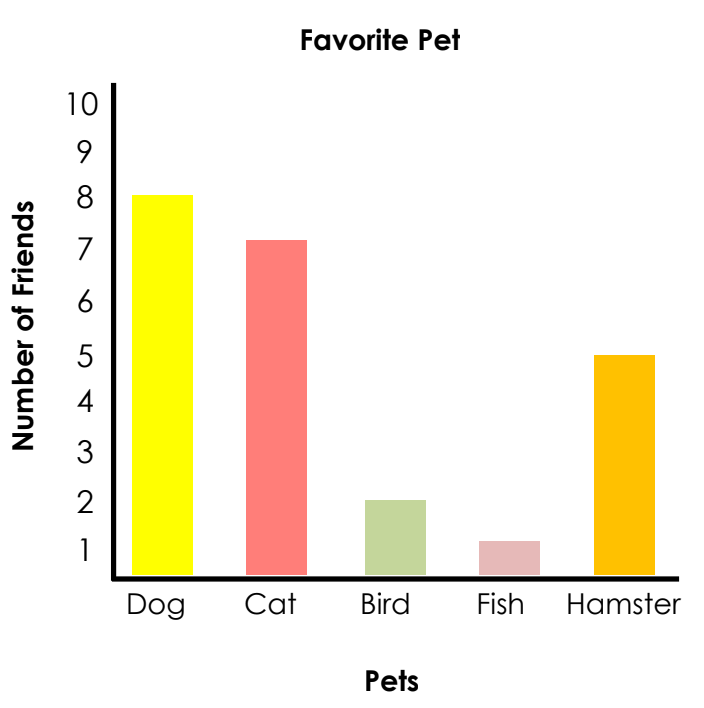
Dog - Hamster
= 8 - 5
= 3
300
How many different coloured squares are there on a Rubix cube?
6
400
Identify the type of sampling technique:
A teacher asks three students for their input on what movie to watch by pulling names out of a hat.
Simple Random Sampling
(involves randomly selecting a set number of people)
400
Will the data collected from the following question be quantitative or qualitative?
What is the average temperature outside each day of March?
Quantitative (numerical)
400
What conclusions can you draw from this frequency table?
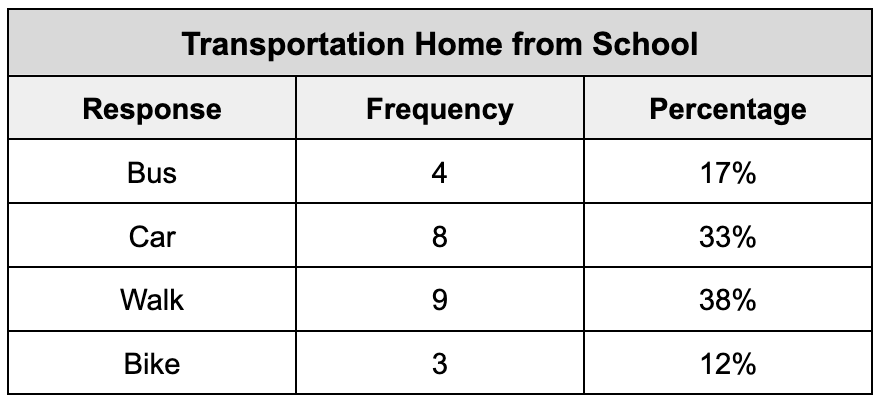
- Most students walk home from school.
- The fewest students bike home from school.
- Almost as many students drive as walk home from school.
400
Compare the similarities and differences between these two graphs. What do you notice?
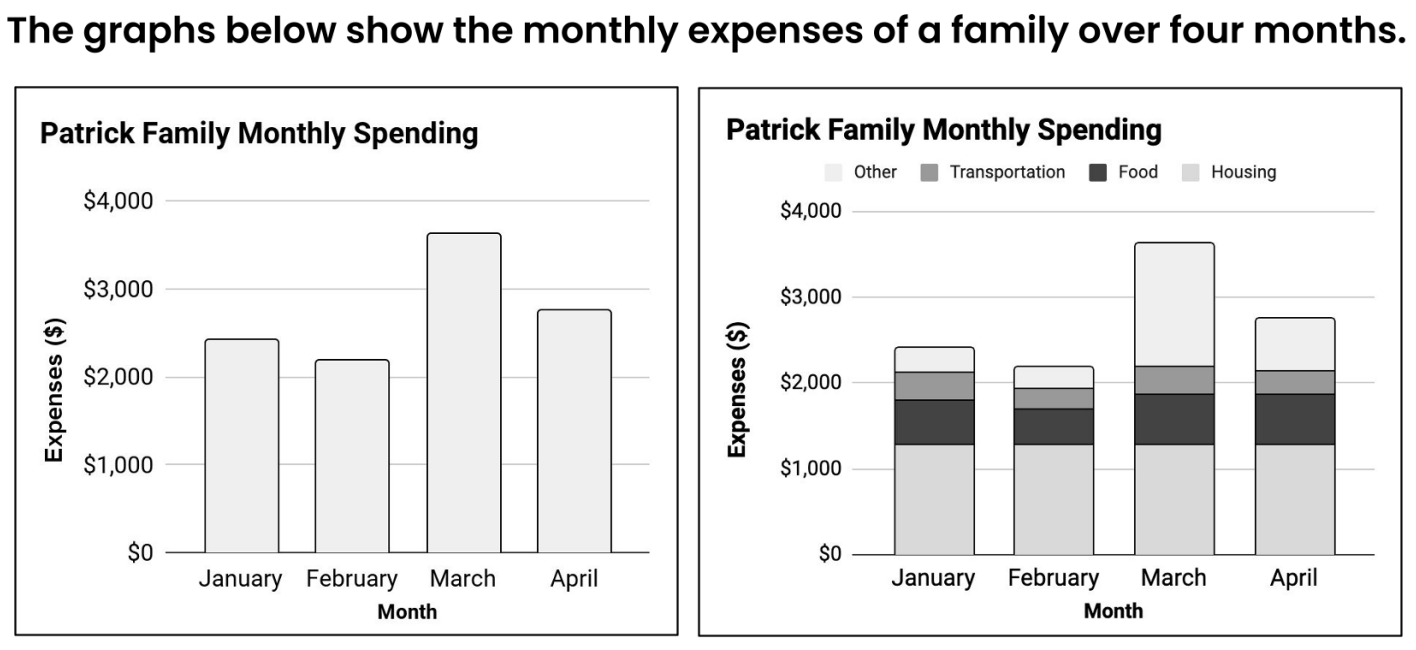
- Both graphs have the same data
- The graph on the right shows the break-down of spending each month by category
400
How many sides does a nonagon have?
9
500
Identify the type of sampling technique:
A restaurant owner asks every other customer about their experience with their service today.
Systematic Random Sampling
(involves randomly choosing individuals at a fixed interval)
500
Will the data collected from the following question be quantitative or qualitative?
What is your favourite brand of running shoe?
Qualitative (non-numerical)
500
Analyze the chart. Describe any trends or patterns that you notice.
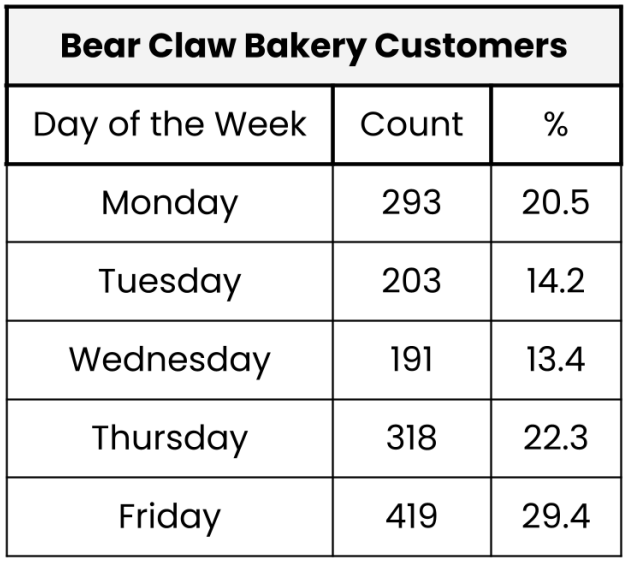
- Sales start off strong, then decrease Tues & Wed, then increase Thurs & Fri
- Nearly 50% of the sales occur on Thurs & Fri
- Significant increase in sales from Wed to Thurs
500
How much money did Ariel raise over all four weeks?
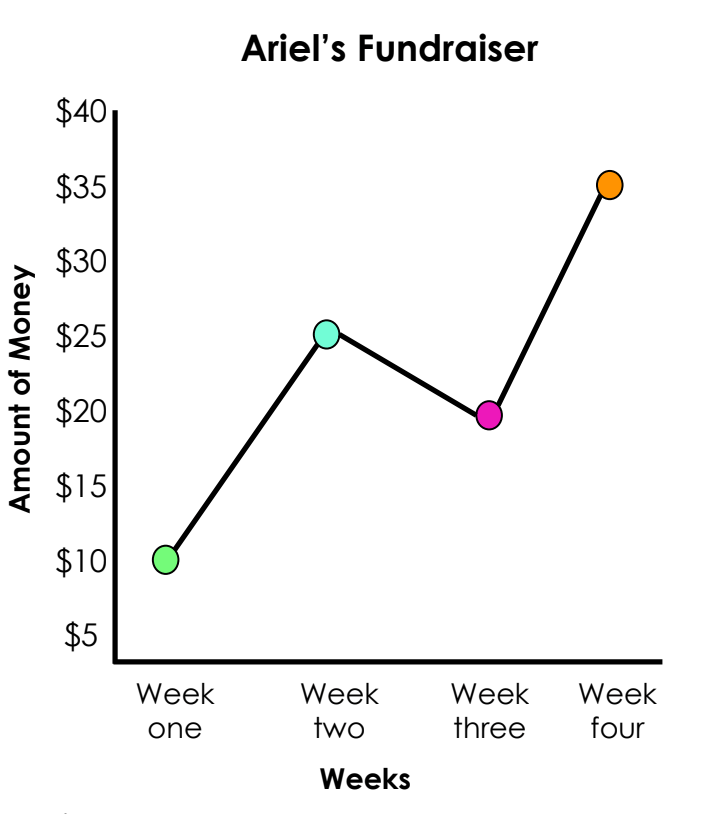
$10 + $25 + $20 + $35
= $90
500
What is the only number that has the same number of letters as it’s meaning?
Four