Pictograph
Read the Graph
Mixed Bag
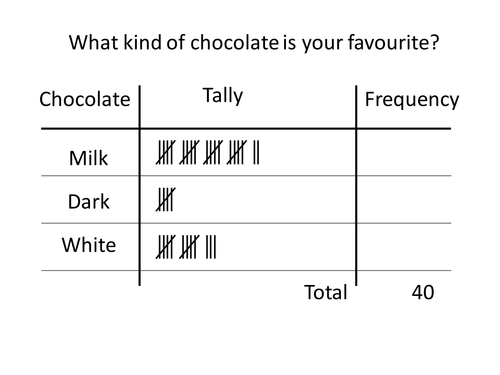
Tally Chart
100

How many people say their favorite fruit is an apple?
What is 10 people?
100

What is the most popular way to get to school?
Bus
100

How many children were at after school care on Tuesday?
What is 5?
100
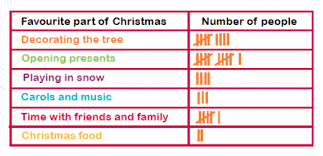
How many people liked "time with friends and family?"
What is 6?
200

How many apples were sold in February?
What is 40 apples?
200
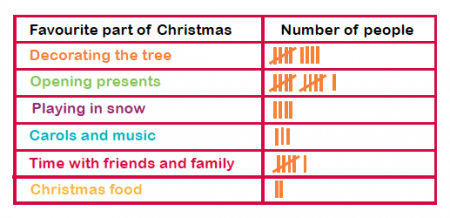 How many people like time with friends AND playing in the snow
10
200
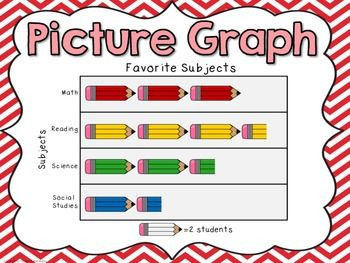
What is the least favorite subject?
What is social studies?
200
Draw 17 tallies.

300
How many people liked the color green?
What is 11?
300
40
300
How many more students liked hockey and baseball combined than soccer?
What is 10?
300
What is 35?
400
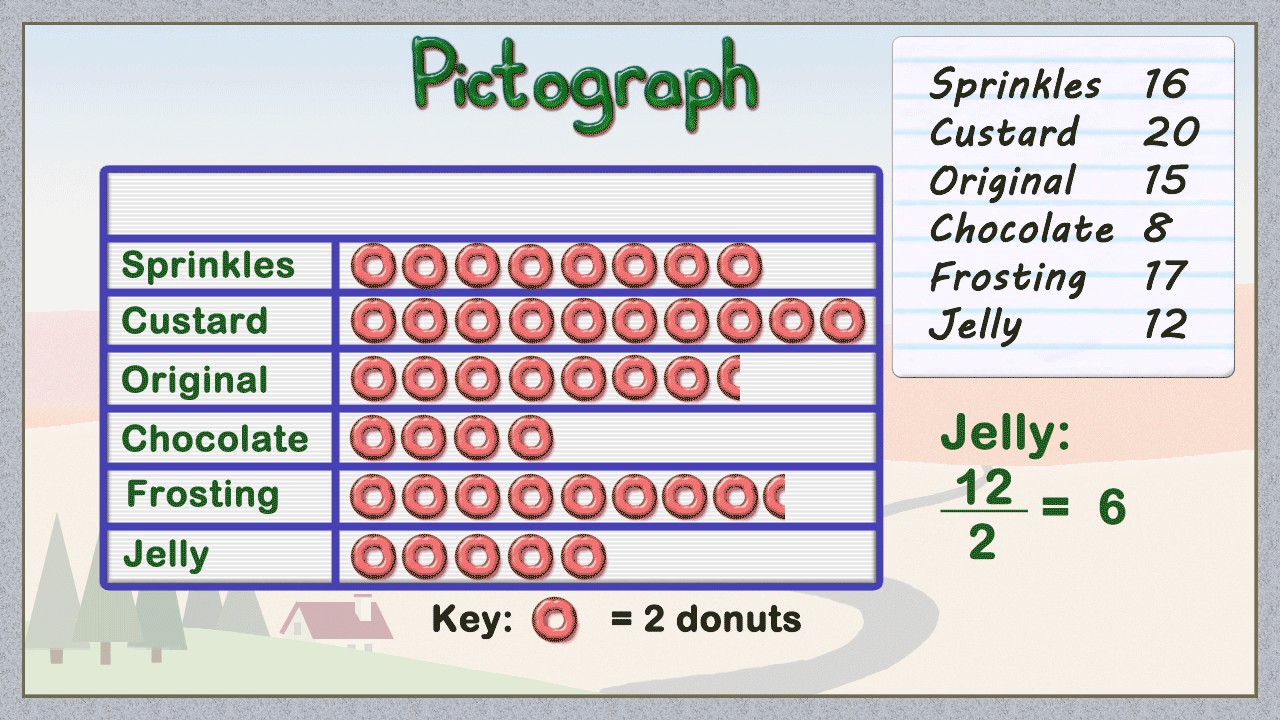 How many people like chocolate and jelly?
What is 18?
400
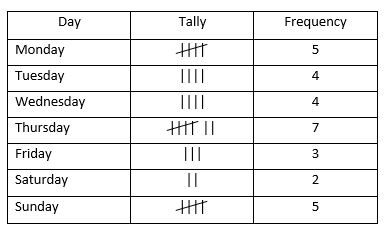
How many people like Sunday and Monday
9
400
 How many more laps did Austin run then William
What is 4?
400
What is the total of these tallies?
What is 60?