estimation
addition
Pie Charts
Talley Charts
graphs and tables
100
round 55 to the nearest 10
60
100
Give an example of an addition problem with a solution.
3+4=7
100
What meal do students like the most?
Breakfast
100
What kind of information does this tally chart give us?
The students' favorite animal.
100

What is the scale of this graph?
The scale is 0-40
200
round the number 823 by the nearest hundred
800
200
find the sum
18+39=
18+39=57
200
How many students like snack?
4
200
Which animal has the most tally marks?
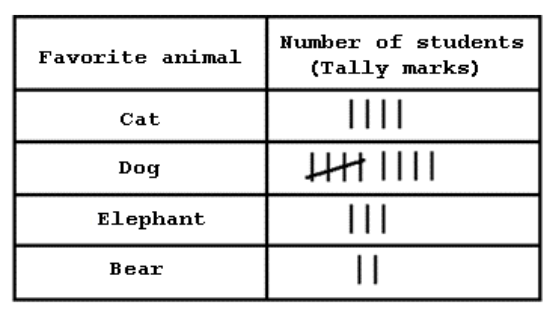
Dog
200
What Month has the greatest number of Birthdays?
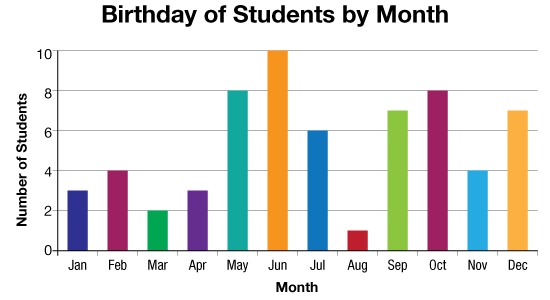
June
300
about how much 45-35=
what numbers do you round to?
50-40=10
round by 10's
300
26+37+14=
26+37+14= 77
300
What is the least favorite meal of the students?

Snack
300
what is the least popular sport from the tally chart?
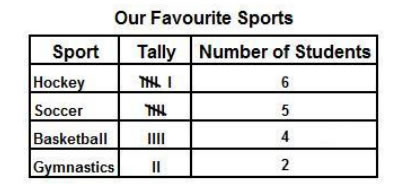
Gymnastics
300
What month has the least number of Birthdays?
August
400
approximately how much is 345+251
what is each number rounded to?
300+300=600
400
Mark has 21 pokemon cards. Emily has 45 pokemon cards. Sara has 37 cards. How many cards do Mark, Emily, and Sara have altogether?
21+45+37=103
400
How many students prefer dinner?
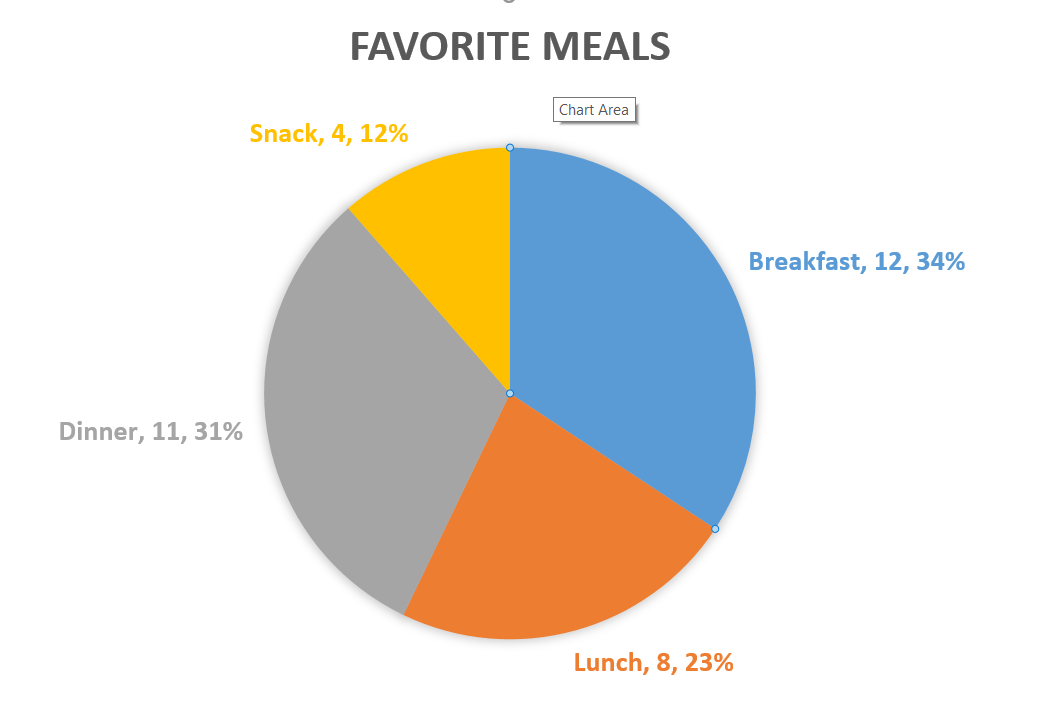
11
400
what is the most popular sport based on the tally chart?
hockey
400
What was the total number of fruit categories in this bar graph
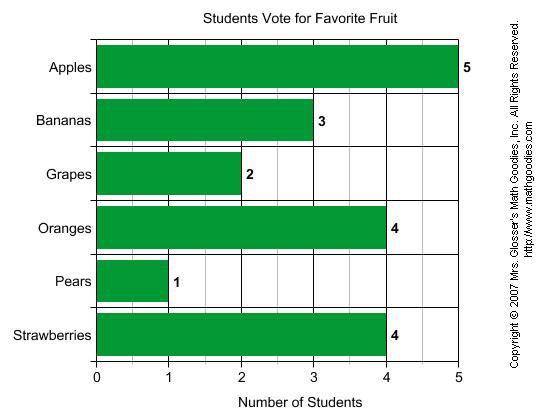
6 fruits
500
explain the best way to round 435-64=
round by 10's or hundreds?
440-60=380
round by 10's
500
Jason has 330 coins. Richie has 268 coins. Rachel has 381 coins. Which two students have more than 700 coins combined?
Jason and Rachel
330+381= 711
(more than 700)
500
How many students are there in all?

35
500
How many students are there in the class altogether?

18
500
How many more students prefer breakfast to a snack?
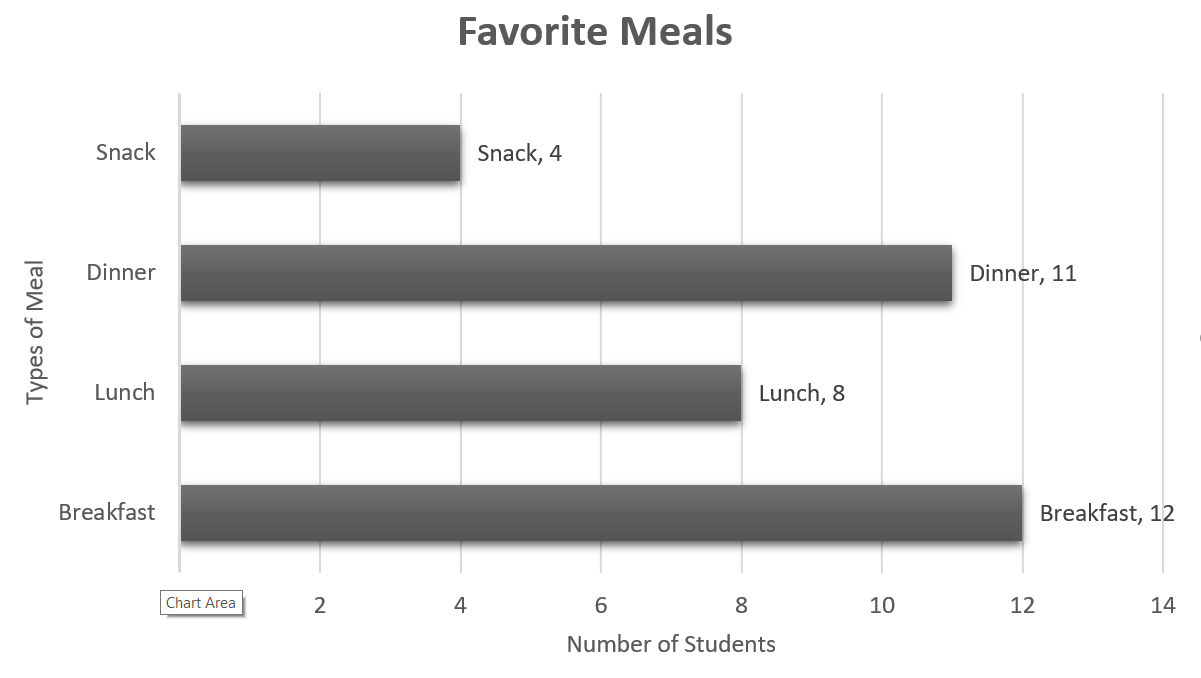
12-4=8