How many students have a birthday in January?
7 students

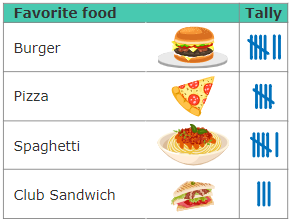
How many people's favorite food was a burger?
7 people
Which fruit was the favorite?
Banana
You can take a survey to collect __________.
a. bar graph
b. picture graph
c. data
d. tallies
c. data

How many more people had a birthday in August than December?

How many people said pizza and spaghetti was their favorite food?
11 people

Who caught the most fish?
Alex
A _____________ uses pictures to show data in a graph.
a. picture drawing
b. picture graph
c. picture scale
d. bar graph
b. picture graph

How many students have a birthday in April and August together?
15 students

How many more votes did burger have than club sandwich?
4 votes

How many children drink milk and juice for breakfast?
16 children
"What is you favorite drink?" could be the ________ question for the graph.
A. data
B. picture graph
C. survey
D. tally marks
C. survey

How many people enjoy chocolate, strawberry, and vanilla?
19 people
How many more votes did orange have than watermelon?
2 votes

How many more fish did Jill and Mara catch together than Alex?
1
A table that uses tally marks to record data.
a. bar graph
b. tally chart
c. picture graph
tally chart

How many people took the survey?
23 people
How many votes in all?
14 votes
Which two fruit equal the same amount as the banana?
Strawberry and Grapes
OR
Apple and Pear
What are the two different types of graphs?
Tally Chart and Picture Graph