Bar Graph
Picture graph
Parts of a Graph
Tally Chart
100

How many students favorite sport is basketball?
What is 6 students?
100

How many people say their favorite fruit is an apple?
What is 10 people?
100

What part of a graph tells what the graph is about?
What is the title?
100
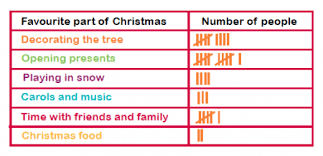
How many people liked "time with friends and family?"
What is 6?
200

How many people own both a rabbit and cat?
What is 15 people?
200

How many apples were sold in February?
What is 40 apples?
200
 What part of the graphs tells you what each picture represents?
What is the key?
200
Go up to the board, and correctly draw 17 tallies.

300
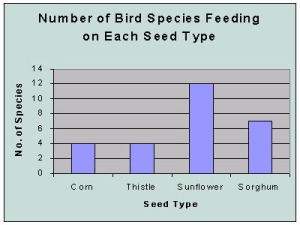
How many fewer birds at Sorghum than Sunflower ?
What is 5?
300
How many people liked the color green?
What is 11?
300
What are different graphs we have learned about?
picture graph, tally chart, and bar graph
300

How many more mangoes than strawberries?
What is 7?
400

How many more students are in 1st and 4th grade combined, than in third grade?
What is 90 students?
400

If the key is 3, how many more people like strawberry than vanilla?
What is 6?
400

How many more people prefer coke over Pepsi?
What is 8?
500
Go up to the board and accurately draw the bar graph, making sure to label.

(add bars)
500
How many more students liked hockey and baseball combined than soccer?
What is 10?
500

What do you call the information in the graphs?
What is data?
500
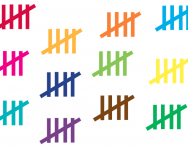
What is the total of these tallies?
What is 60?