Line Plot
Bar Graphs
Pictograph
Tally Chart
100
 How many students have 3 pets?
5 Students
100
 Which job do students want to do the least?
Mail Carrier
100
 What is the most important thing to look at on this graph?
THE KEY!!!!!!
100
 Create a Tally Chart with the information given above.

200
 Which number of phone calls did most friends make?
6 phone calls
200

Which job do most students want? How many students
want this job?
teacher; 38 students
200
 Who has visited the most states? How many states has that
person visited?
Who has visited the most states? How many states has that
person visited?
Pat; 40 States
200
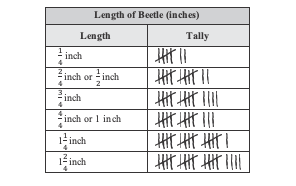 What size of beetle appeared most frequent?
1 2/4 inch
300
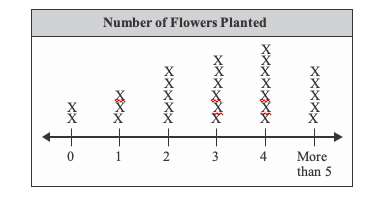 How many people planted 3 or MORE flowers?
18 people
300
How many students want to be a chef, doctor, and zookeeper?
72 Students
300
 Who read the most books? How many books did he or
she read?
Who read the most books? How many books did he or
she read?
Paula; 51 books
300

How many more beetles are 1 and 1/4 in. long than 1/4 in. long?
12 beetles
400
 How many more people planted 4 or MORE flowers than 1 or fewer flowers?
7 more people
400

Antoine makes a pictograph using the data from the bar graph above. He uses the symbol * to represent the votes. How many people should his * represent? Explain your reasoning.
See work
400
 How many more states have the person who visited the most
states visited than the person who has visited the least?
How many more states have the person who visited the most
states visited than the person who has visited the least?
36 states
400

How many beetles measures 1 inch or longer?
43 beetles