Bar Graph
Pictograph
Mode
Range
2 Way-Tally
100

How many students favorite sport is basketball?
What is 6 students?
100

How many people say their favorite fruit is an apple?
What is 10 people?
100
What is the mode of this data:
2, 3, 3, 3, 4, 5
3
100
What is the range of this data?
2, 3, 4, 5, 6, 7, 8, 9
7
100
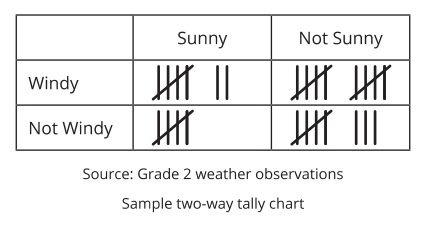 How many days are windy, sunny & not wind, sunny?
12
200

How many people own both a rabbit and cat?
What is 15 people?
200
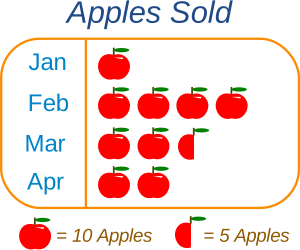
How many apples were sold in February?
What is 40 apples?
200
What is the mode of this data?
4, 5, 6, 7, 7, 8, 8, 8, 9, 20
8
200
What is the range of this data?
5, 7,12, 45, 50
45
200
What are all the options in this 2- way tally table?
Windy and Sunny
Windy and Not Sunny
Not Windy and Not Sunny
300
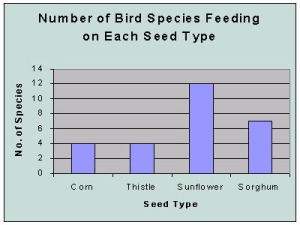
How many fewer birds at Sorghum than Sunflower ?
What is 5?
300
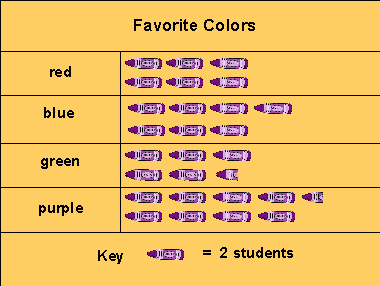
How many people liked the color green?
What is 11?
300
What is the mode of this data?
12, 13, 14, 13, 15, 16, 13, 17, 18
13
300
What is the range of this data?
10, 12, 14, 15, 17, 20, 25, 27
17
300
How many cards game cards and sport cards are in good condition? 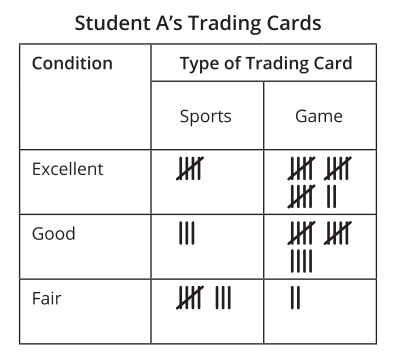
18
400

How many more students are in 1st and 4th grade combined, than in third grade?
What is 90 students?
400
How many more people have Type B than Type AB
15
400
What is the mode of this data?
20, 25, 21, 26, 20, 21, 20, 25
20
400
What is the range of this data?
20, 4, 1, 7, 30, 18, 25
29
400
How many game cards are in excellent condition &
game cards, fair condition?
15
500
Why would you use a double bar graph?
to compare data even further into two subcategories
500
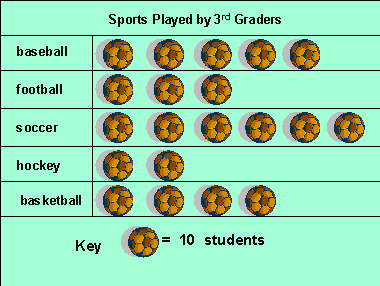
How many more students liked hockey and baseball combined than soccer?
What is 10?
500
What is the mode of this data?
31, 14, 27, 33, 31, 14, 27, 31, 8, 23, 31
31
500
What is the range of this data?
17, 45, 45, 17, 20, 15, 28, 31, 26, 77, 99, 36, 45, 45
84
500
How many more game cards are in excellent condition than sports cards in fair condition?
9