Pictograph
Line Graph
Bar Graph
Pie Graph
Line Plot
100

How many apples were sold in April
20 apples
100
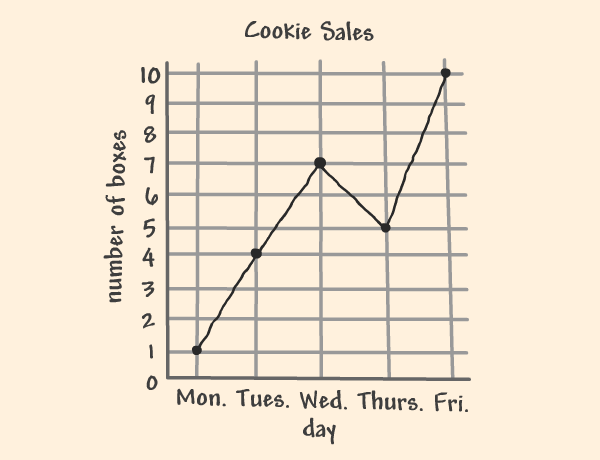 How many boxes of cookies were sold on Wed.?
7 boxes
100

What is the topic of this graph?
Favorite sports of students
100

True or False: This graph is about favorite foods.
False
100
 What is the topic of this graph?
Hours of exercise by individuals.
200
How many Apples were sold in February and April?
60 apples
200
On which day were the most cookies sold?
Friday
200
How many students' favorite sport is softball?
4 students
200
What percentage of people in this survey at vegetables yesterday.
14%
200
How many people exercised for 0 hours?
3 people
300
How many fewer apples were sold in January than March?
15 apples
300
How many fewer boxes were sold on Thursday than Wednesday?
2 boxes.
300
How many more students played the most popular than the least popular sport?
9-3=6
300
What food did people eat the most of?
Meat
300
How many people exercised for 1/4 hours or less?
9 people
400
Were more apples sold during the first two months or the last two months?
First two. (Jan & Feb)
400
If 1 box has a dozen cookies, how many cookies were sold on Tuesday?
48 cookies.
400
How many more students like basketball than softball?
2 more students
400
Which two food groups had an equal number of people eat them?
Vegetables and Bread
400
How many people in this survey exercised 1/2 hour or more?
11 people
500
How many more apples were sold?
95 apples
500
How many boxes were sold that week?
27 boxes.
500
How many students chose something other than soccer?
13 students
500
What percentage of people at vegetables and ice cream?
43%
500
How many people exercised?
20 people