position vs time
distance vs time
velocity vs time
Kinematics
Free Fall
100
Based on the graph the object ends at this position. 
What is 0.5 m?
100
According to the graph the object is going towards its starting location (going home) during this time interval. 
What is 15 to 23 seconds? (notice the slope is negative)
100
According to the graph the car is traveling at a constant speed over this time interval. 
What is everywhere EXCEPT from about .7s to about .8s? The areas where the graph is flat shows constant speed.
100
A bowling ball rolls down a lane at 9 m/s. If the ball can reach the pins 3 seconds later, how long is the lane?
What is 27m?
100
This is the motion for any object that is in free fall.
What is accelerating downwards?
200
Based on the graph below, the object has traveled this far after 7 seconds.
What is 1.3 m? x0=0.2m, x1=1.0m, and x2=0.5m, so total distance equals the difference between x1 and x0, x2 and x1, then adding both distances together. 0.8m + 0.5m = 1.3m.
200
Based on the graph the object's displacement is
What is -3 m?
200
According to the graph the object is traveling at zero meters per second at this time(s). 
What are 6 seconds and 18 seconds?
200
A car with an initial speed of 5.43 m/s accelerates at a rate of 3.21 m/s2. What is the final speed of the car after 5.25 s?
What is 13.9 m/s?
200
This is the acceleration due to gravity
What is 9.8m/s2?
300
Based on the graph what is the object's displacement in 7 seconds is____ m
What is 0.3 m? Notice it starts at 0.2 m and ends at 0.5 meters.
300
According to the graph the bicyclist is traveling the fastest during this section. 
What is section E to F? We are looking for the steepest section of graph.
300
According to the graph the object is traveling at -5.0 m/s during this time interval. 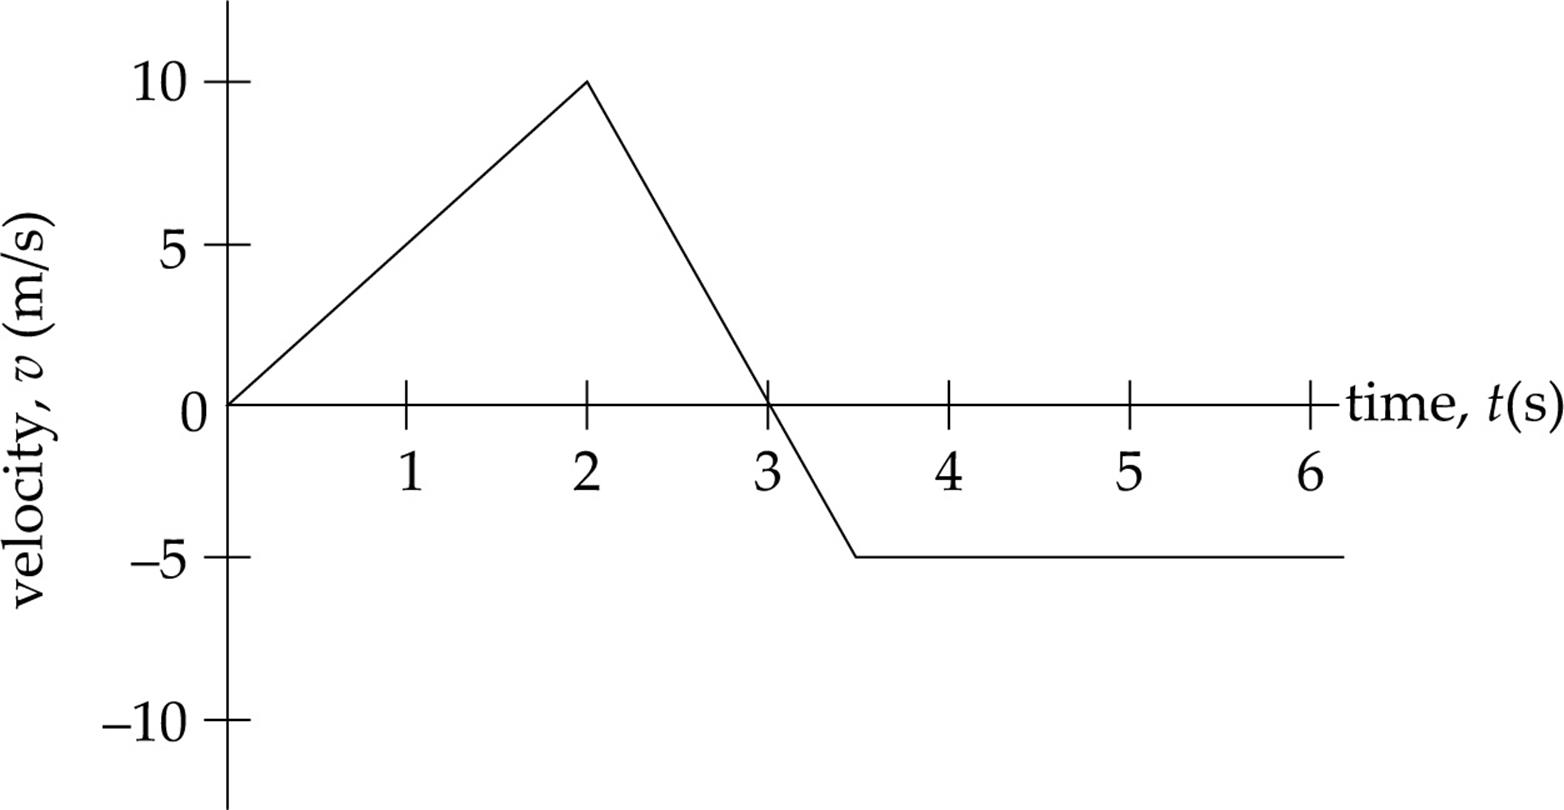
What is 3.5 to 6 seconds?
300
A ferrari with an initial velocity of 12.3 m/s accelerates at a rate of 5.05 m/s2 for 3.21 s. What is its final velocity?
What is vf = 28.5 m/s?
300
An object thrown upwards reaches this speed at the highest point.
What is 0?
400
According to this graph object _________ is at rest. 
What is object C?
400
According to the graph, this object has traveled the greatest distance at 2 seconds. 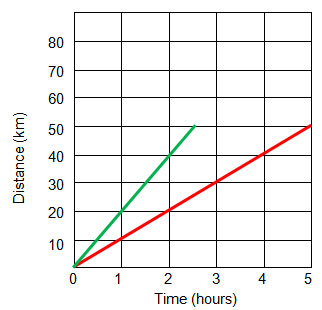
What is the green object? notice it has gone 40 km at 2 seconds and the red object has only gone 20 km at that same time
400
According to the graph this section represents a object slowing down.

What is section 4. Slope of a V graph is acceleration. Slowing down is a negative acceleration (slope)
400
A car is traveling with a velocity of 7.7 m/s and accelerates uniformly at a rate of 0.88 m/s2 for a distance of 357 m. What is the car's velocity at the end of the acceleration?
What is vf = 26 m/s ?
400
An object is dropped from a cliff and hits the ground 4.5s later. This is the velocity of the object just before it hits the ground.
What is 44.1 m/s?
500
According to this graph object(s) _______ is accelerating throughout the entire time of travel. 
What is object C? Careful, object D starts out with a flat graph, indicating it is at rest and then it accelerates.
500
According to the graph the red object has a constant speed of __________ km/hr.
What is 10 km/hr? Total distance 50 km total time 5 hours 50/5 = 10 km/hr
500
According to the graph what is the acceleration of the object in the first 2 seconds?
What is 5 m/s2?
500
A sailboat starts from rest and accelerates at a rate of 0.23 m/s2 over a distance of 280 m. What is the boat's final velocity?
What is vf = 11 m/s ?
500
A bowling ball is dropped from a 15m tall building. This is how long it will take the ball to reach the ground.
What is 1.75 seconds?