Graphing Vocabulary
Coordinate Grids
Analyzing Graphs
Number Patterns
100
What is being measured on the X-axis?

The week number.
100
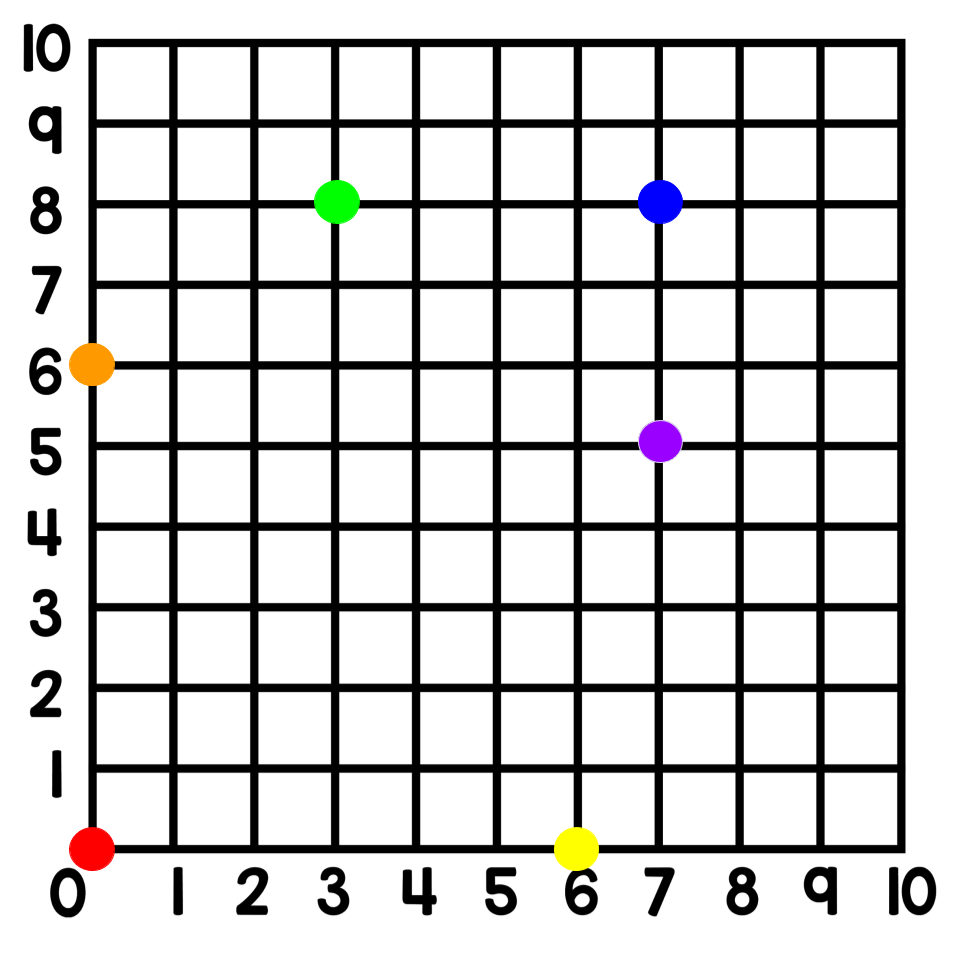
What color point is at the origin?

Red
100
Which puppy weighed approximately 5 ounces at birth?
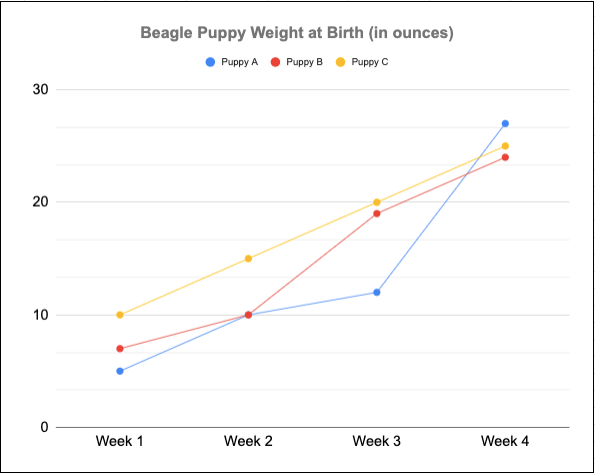
Puppy A
100
What is the missing number?
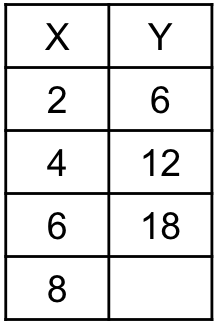
24
200
What is being measured on the Y-axis?

Each puppies weight.
200
What color point is at 7,5?

Purple
200
Which puppy appears to be growing at a constant rate of change?

Puppy C
200
Finish the table.
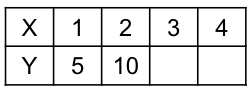
15, 20
300
What is the title of the graph?
Beagle Puppy Weight at Birth (in ounces)
300
Which point lies directly on the x axis? (excluding the origin)

The yellow point
300
Which puppy will most likely reach 30 ounces by week 5?

Puppy A
300
If the rule is X + 3, finish the Y pattern.
4, 6, 8, 10
400
At what week do the lines intersect?
Week 2
400
Which point lies directly on the y axis? (excluding the origin)

The orange point
400
If the red line represents the average precipitation, what are the four wettest months?
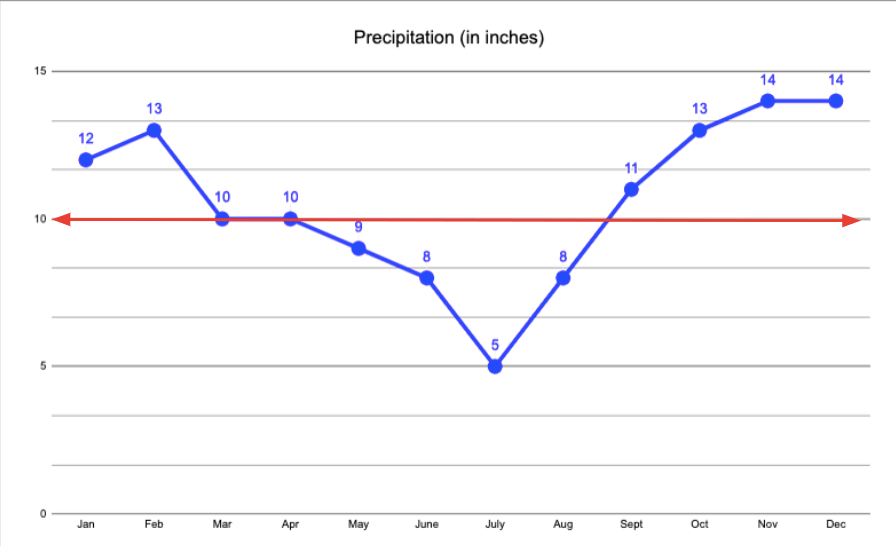
February, October, November & December
400
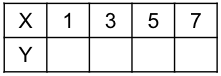
Explain the mistake the student made when they graphed the table.
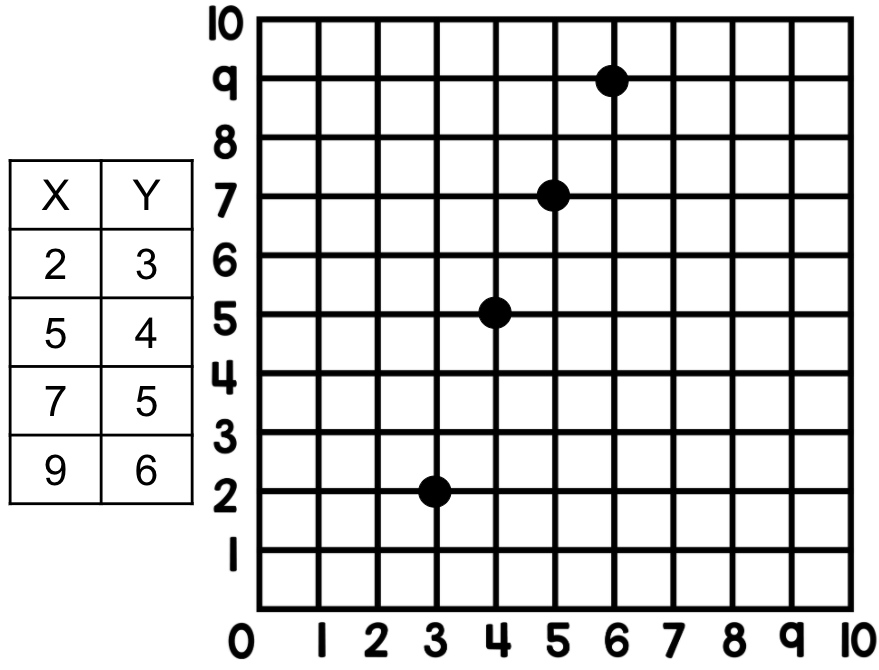
The student graphed the y pattern on the x axis and the x pattern on the y axis.
500
What is the scale?
10 ounces (scale is on the y-axis)
500
What point could be added to create a rectangle?
(3,5) or (6,6)
500
If the red line represents the average precipitation, which months have below average precipitation?

May, June, July & August
500
The graph shows total number of necklaces made. If the pattern continues how many necklaces will be made on day 13?

7 necklaces