Graphs
Venn Diagrams
Scatter plots
Circle graphs
Bar Graph
100
What is the horizontal axis on a bar graph called?
x-axis
100
Of the students, 9 have been to China. 7 students have been to India. 5 students have been to both China and India. How many students have been to India but not China?
2
100
What trend does the graph show?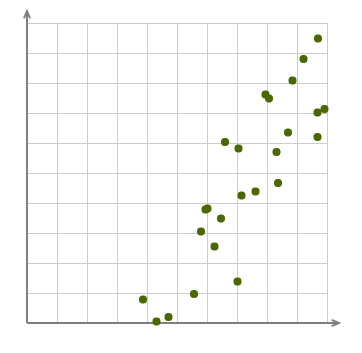
positive trend
100
What is another name for a circle graph
a pie chart
100
What is considered the nicest fruit?

blueberry
200
What is the vertical axis on a bar graph called?
y-axis
200
Of the students, 7 like sharks and 7 like polar bears. 4 students like both sharks and polar bears. How many students like sharks but not polar bears?
3
200
What trend does the scatter plot show?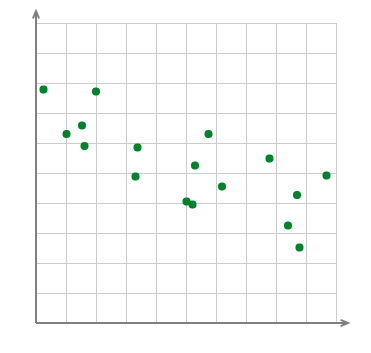
negative trend
200
If Ms. Martinez' class has 55 students and 20% of the students have black hair, how many students have black hair?
11 students
200
What is the favorite type of movie?
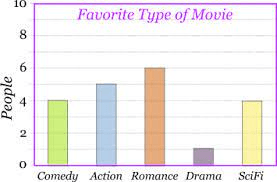
romance
300
A bar graph with bars that touch is called a __________.
a histogram
300
9 students like ketchup and 9 like pickle relish. 5 students like both ketchup and pickle relish. How many total students are there?
13
300
What trend does the scatter plot show?
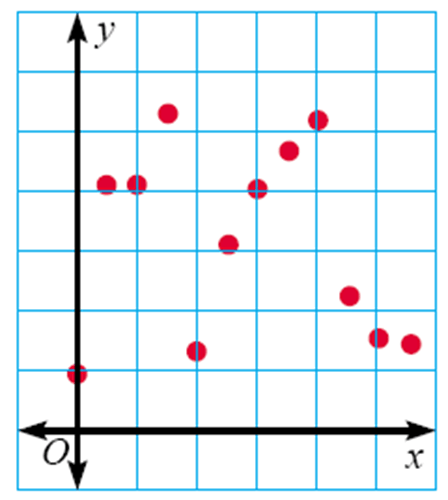
no trend
300
Draw/show 25% of a circle graph.
Shade 1/4 of a circle
300
What is the favorite color of the children?

yellow
400
A line graph shows change over ____________.
time
400
7 of the students in the class like crocodiles. 10 students like alligators, and 3 students like both crocodiles and alligators. How many total students are there?
14
400
As temperature increases, how do visitors numbers change?
beach visitors increase. This shows a positive trend.
400
What total percent does a circle graph equal?
100%
400
How many black cherry trees are between 70 and 75 feet tall?
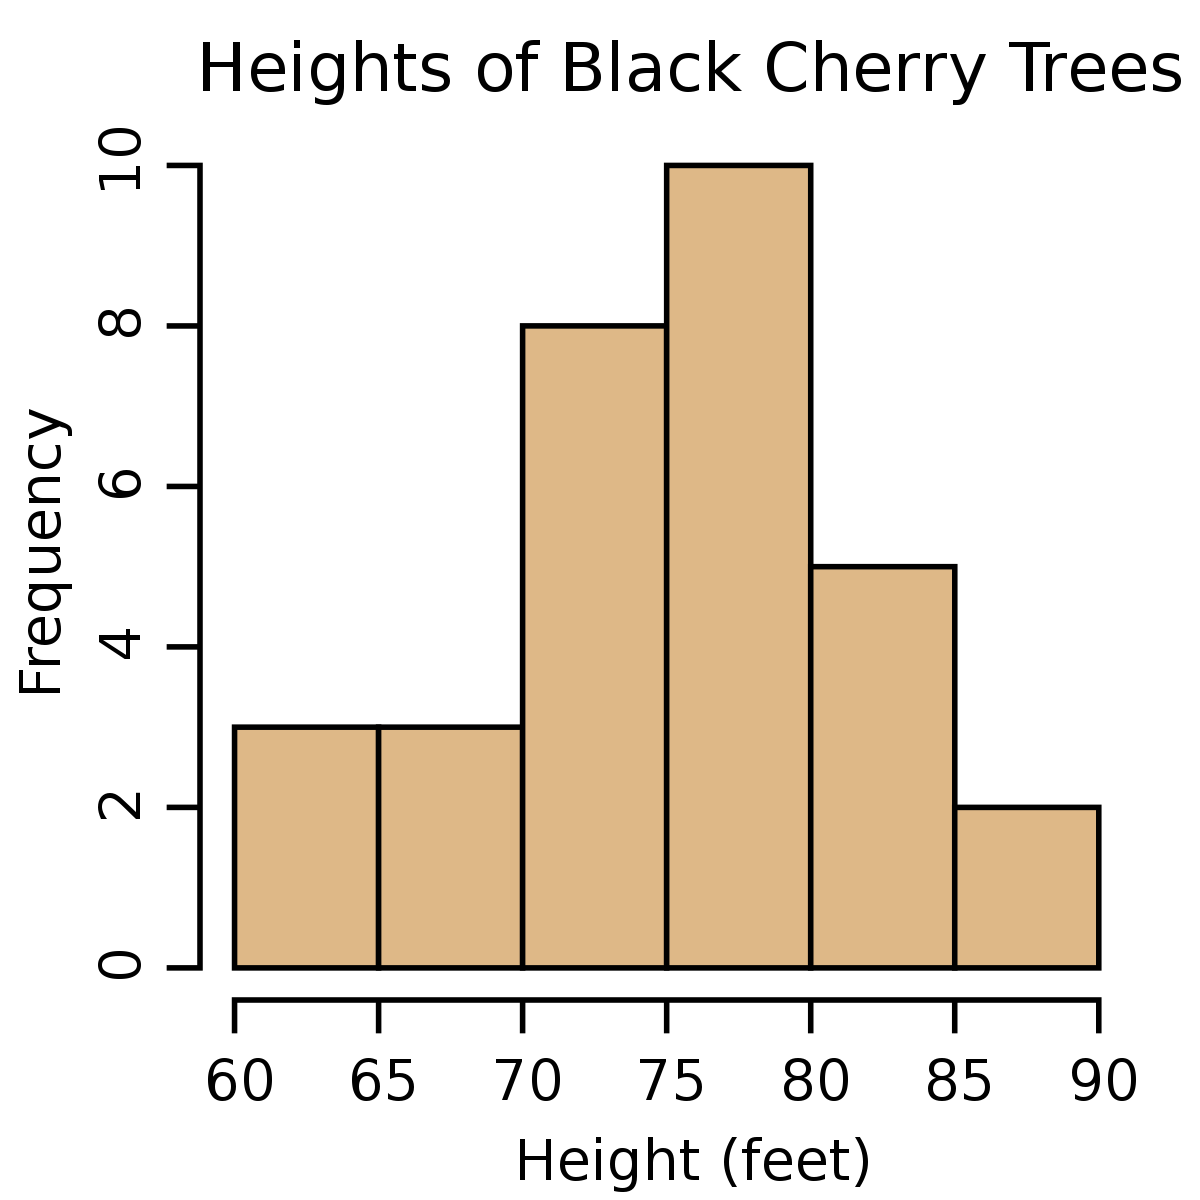
8
500
What do we use a scatter plot for?
Analyzing if there is a relationship between two sets of data.
500
Of the people on Erica's street, 10 have visited an art museum. 10 people have visited a farm. 6 people have visited both an art museum and a farm. How many people have visited an art museum or a farm or both?
14
500
How are last digits of phone numbers and test scores related to each other?
no trend
500
What is circle graph best used for?
To show parts compared to a whole
500
How many children scored between 60 and 80 on the final exam?
40