Stem-and-Leaf Plots
Mean, Median, Mode, and Range
Bar graphs
histograms
Box and Whisker Plots
100
True or False: The stem can only be a single-digit.
False
100
What is the median:
3, 19, 9, 7, 27, 4, 8, 15, 3, 11
8.5
100
True or false:
In a bar graphs allbars must touch one another.
False, that is in th histograms
100
true or false:
In a histogram the numerical information is always groups in intervals.
true
100
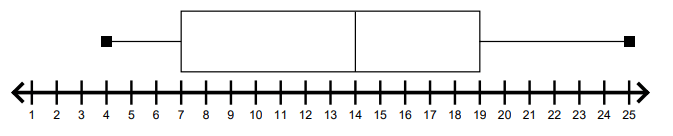
What is the median?
15
200
What place value does the LEAF in Stem and Leaf plots represent?
Ones Place Value
200
Find the Mean:
2,4,6,19,28,28,35,29
18.875
200
What is one difference between bar graphs and histograms?
Bar graphs have spaces between the bars, Histograms do not. Histograms have intervals. Bar Graphs tell you about certain categories.
200
For a histogram, the frequency is always on which axis?
y axis
200
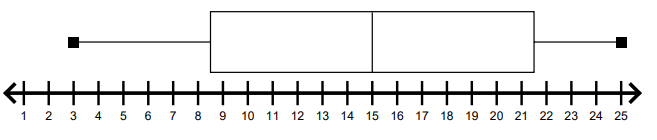
What are the lowest and highest numbers?
Lowest-4
Highest-25
300
What is the MODE of the stem and leaf plot below: 
35 and 41
300
What is the Mode of the given set of numbers:
3,7,9,7,7,1,10,7,1,9
7
300
Based on this graph, what is the favorite type of movie?
romance
300
This is the histogram that is labeled correctly.
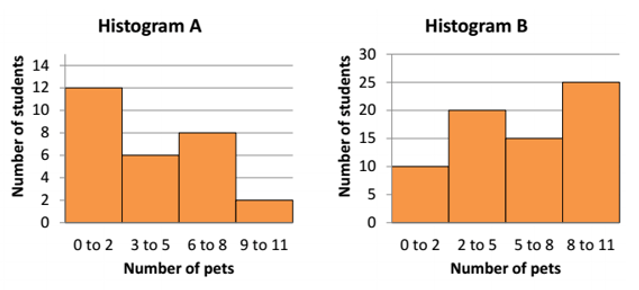
histogram a
300
Find the Interquartile Range.
13
400
What is the RANGE of the stem and leaf plot below:
48
400
True or False: Range is the average of a set of numbers
false, range is the difference between the highest and the smallest number
400
Based on this graph, what is the least favorite type of movie?
drama
400
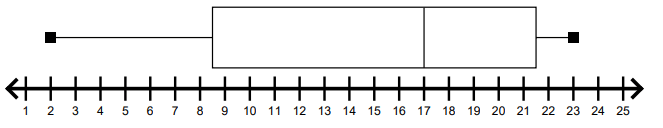
How many students are represented in this graph?
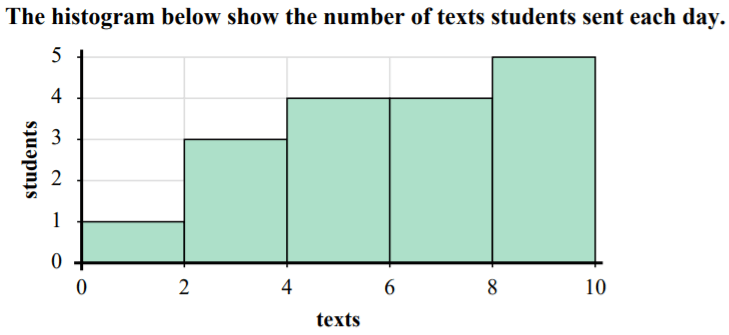
17
400
A plot that uses a number line to show the distribution of a set of data by using five values.
Box-and-Whisker Plot
500
What is the MEDIAN of the stem and leaf plot below:
35
500
Find the Median and Mode of the given set of numbers:
2,2,5,7,9,9,12,14,14,20,20,20
Median: 10.5
Mode: 20
500
Based on this double bar graph, what do colors represent?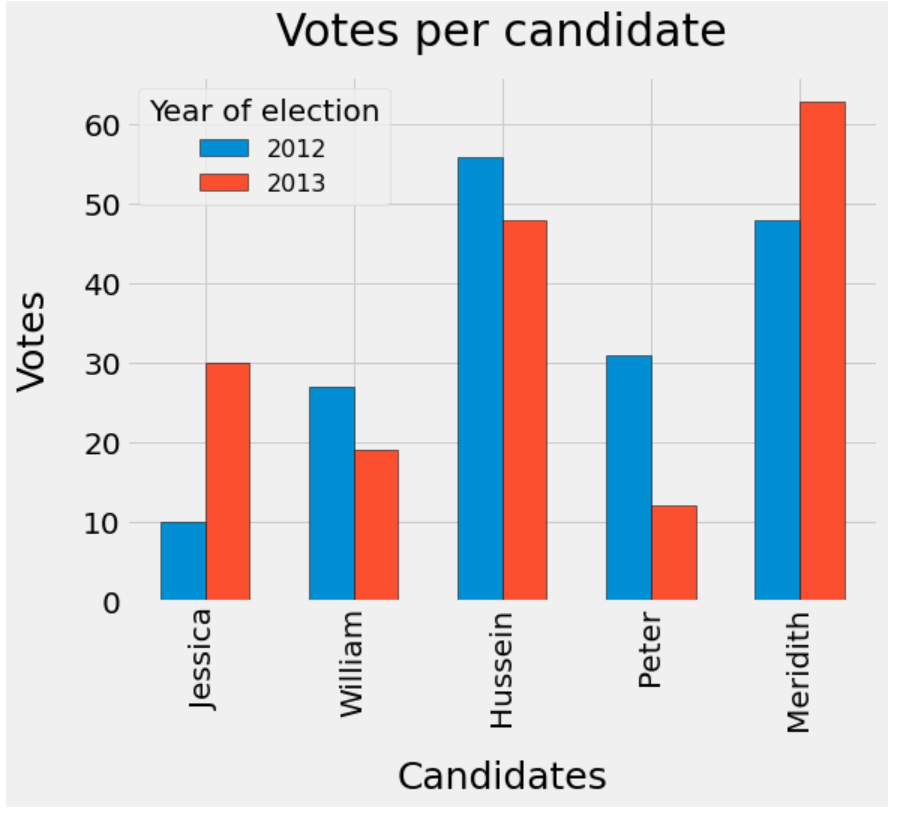
The years of the elections.
500
Is this a correct histogram?
:max_bytes(150000):strip_icc():format(webp)/Histogram2-3cc0e953cc3545f28cff5fad12936ceb.png)
no, bars must be touching.
500
What is the Upper and Lower Quartiles of this set of data?
4, 7, 5, 3, 9, 6, 4
Upper=7
Lower=4