This is a graph that uses bars to display counted data.
What is a bar graph?
This is the variable in an experiment that I can control.
What is independent variable?

The amount of students that like baseball the best.
What is 6 people?

This is the least favorite sport.
What is Ice Hockey?

The type of graph?
What is a bar graph?
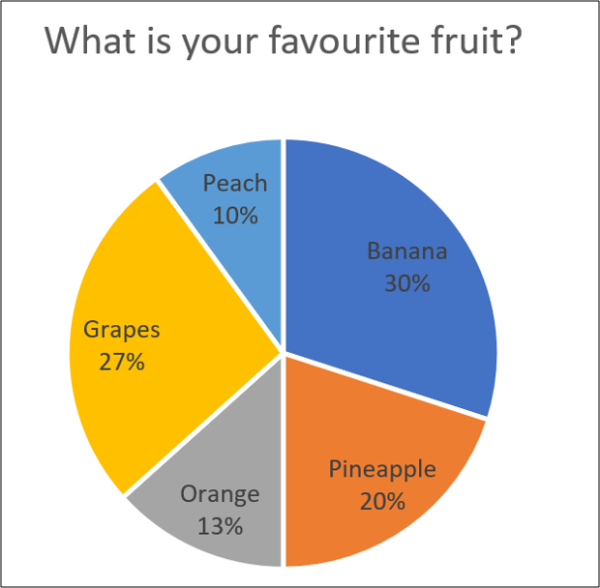
This is a graph that uses percentages to display data in slices.
What is a pie/circle chart?
This is the variable that changes in response to the controlled variable.
What is dependent variable?
A researcher is working on a study to find out if residents of a certain city still buy ice cream cones. The researcher wants to know how many ice cream cones were sold in the certain city in the year 1978. The researcher wants to build a bar graph. What variable would the researcher graph on the horizontal axis?
What is year?

This is the third most favorite fruit.
What is pineapple?
 Reason this graph is incorrect.
What is does not equal 100%?
This is a table that shows comparison or contrasting of two data sets.
What is a data table (t-chart).
It is a variable whose value depends on the other variable.
What is a dependent variable?
All line graphs have these 3 things.
What is a axis labels, data, scale.

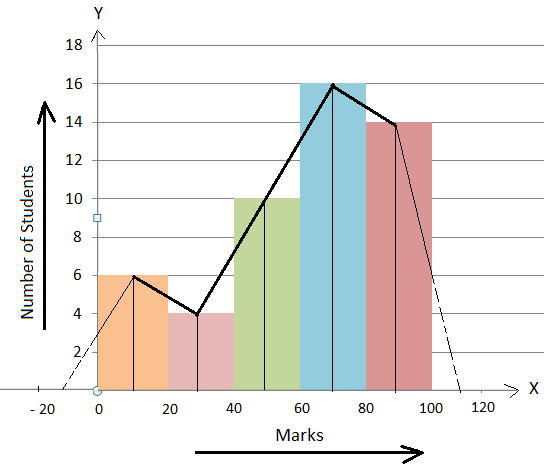
Number of students that scored 20 - 40 marks.
What is 4 students?
The least favorite cookie among the boys.
What is sugar cookie?
This is a graph that shows changes occurring in related variables.
What is a line graph (time series graph)?
When graphing information from the data table, what variable we graph on the vertical axis?
What is a dependent variable?
The percentage an entire circle graph contains.
What is 100%?
This type of graph is best used to show amount of rainfall in Dallas County over a ten year period.
What is a Line graph (time series graph)?
Line graphs should always have a consistent _________.
What is a scale?
This graph should always have a consistent scale.
What is a line graph?
When graphing information from the data table, what variable we graph on the horizontal axis?
What is an independent variable?

The total number of students.
What is 29 students?

This much more rain fell in Feb of 1990 than in Feb of 1989.
What is 2 inches.
A graph that uses slices to represent quantities.
What is a pie chart?
