Bar Graph
Pictograph
Mixed Bag
Tally Chart
100
What goes at the top of all graphs?
The title?
100

How many people say their favorite fruit is an apple?
10 people
100

How many children were at after school care on Tuesday?
5
100
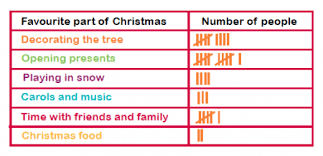
How many people liked "time with friends and family?"
6
200

How many people own both a rabbit and cat?
15 people
200

How many apples were sold in February?
40 apples
200
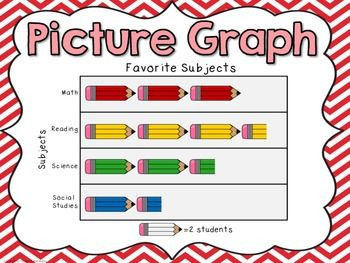
What is the least favorite subject?
Social studies
200
Go up to the board, and correctly draw 17 tallies.

300
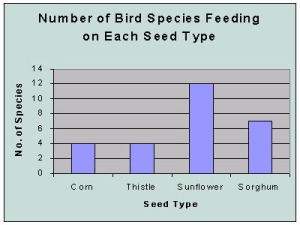
How many fewer birds at Sorghum than Sunflower ?
5
300
How many people liked the color green?
11
300

How many people like tennis and basketball?
12
300
What do we call a table with tallies on it?
A tally chart
400

How many more students are in 1st and 4th grade combined, than in third grade?
90 students
400
What is the name of the place you can find how much a image is worth on a pictograph?
The key
400
What do we call when we ask many people questions to collect data?
A Survey or Poll
400

How many Deer and Elephants are at the Zoo?
18
500
Go up to the board and accurately draw the bar graph, making sure to label.

(add bars)
500
How many more students liked hockey and baseball combined than soccer?
10
500
Why do we have graphs?
To organize data
500
Draw 63 tallies
*work*