Line Plots
Picture Graphs
Tally Charts
100

The number of cars sold on Sunday.
3
100
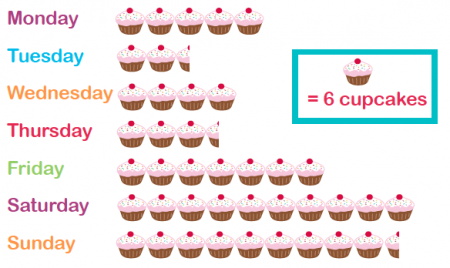
How many cupcakes did they eat on Wednesday? (Each cupcake picture equals 6 cupcakes)
24
100
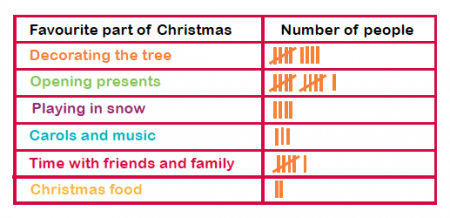
How many people like opening presents during Christmas time?
11
200
The number of cars sold on Monday and Tuesday.
7
200
How many cupcakes did they eat on Tuesday? (Each cupcake picture equals 6 cupcakes)
15
200

How many students like Granny Smith and Golden Delicious apples?
9
300
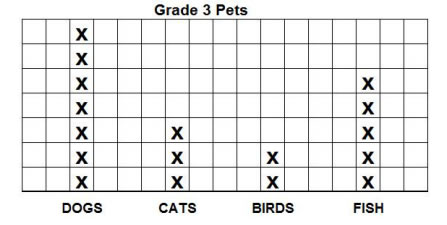
How many more people have dogs than fish?
2
300

How much candy did they eat in all? (Each picture of candy equal 2 pieces)
22
300
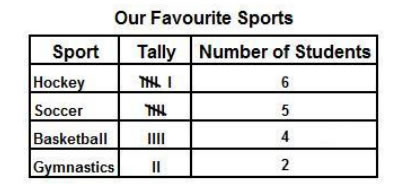
How many more students like hockey and basketball than soccer?
5
400
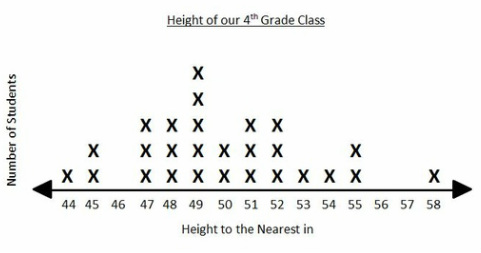
How many students are taller than 54 inches ?
3
400

How many more students chose cherry pie than chicken? (Each picture is equal to 2 people.)
4
400
How many students chose blue or black?
21
500
How many cars were sold on Monday, Tuesday, and Sunday?
10
500

How many types of apples are there in all?
150
500
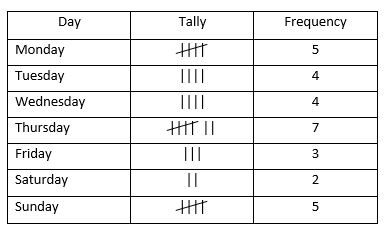
How many students did NOT choose Monday, Tuesday, or Wednesday as their favorite day?
17