Bar Graph
Pie Chart
Pictogram Chart
Line Graph
Wild Card
100
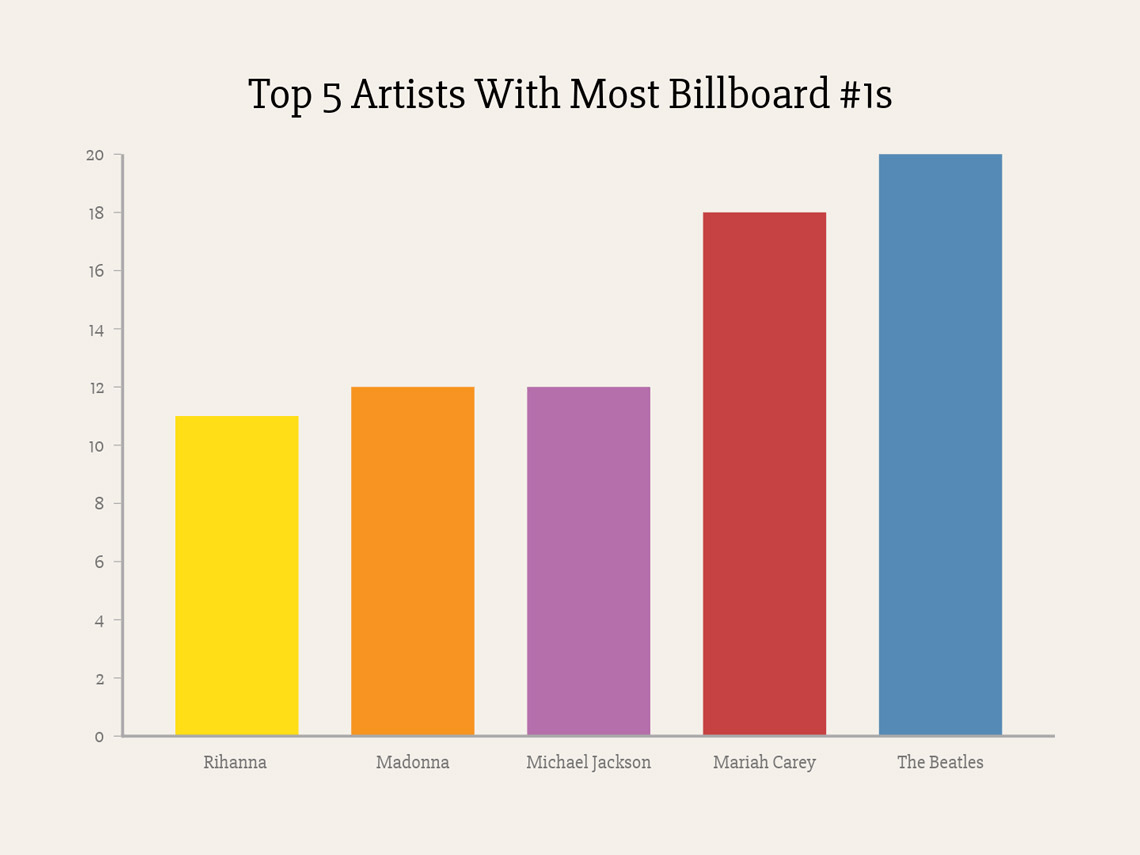
What is this graph about?
Top 5 Artists with Most Billboard #1s
100
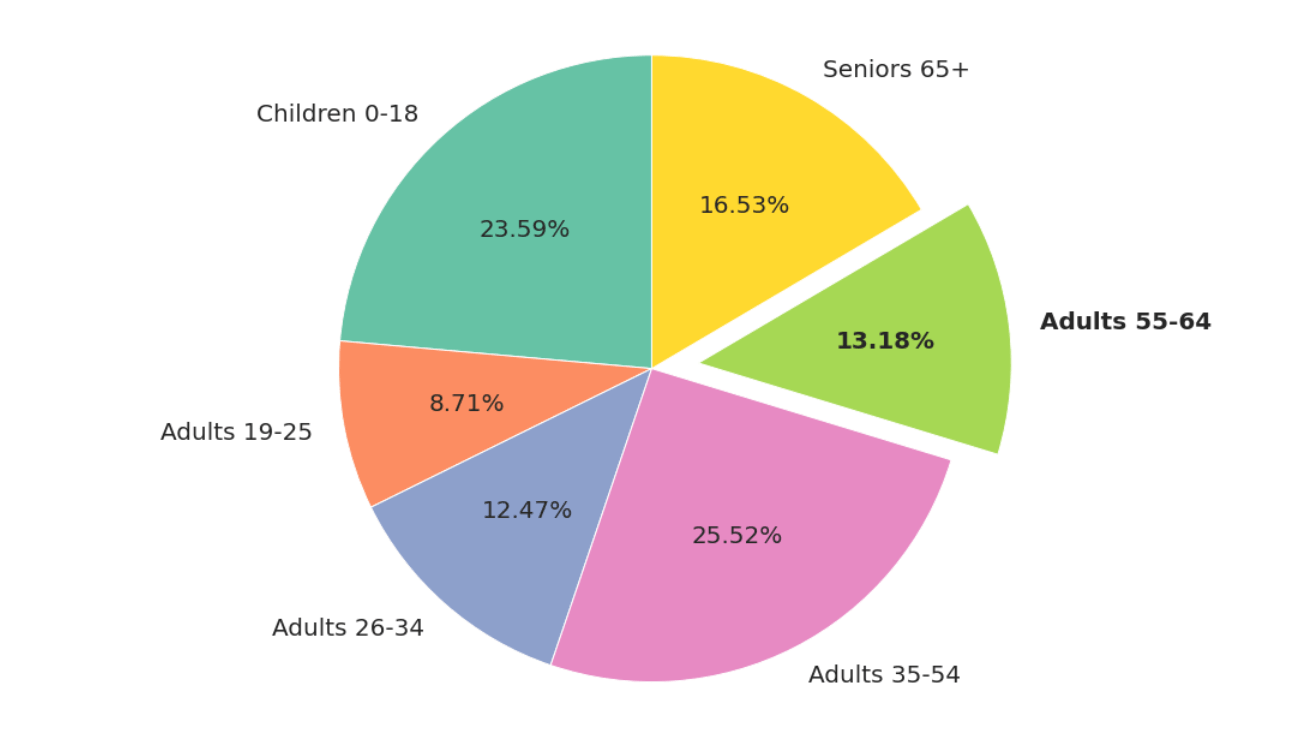
What information is this pie chart comparing?
Ages
100

How many tickets were sold on day 6?
100
100

What month had the lowest savings?
February
100
The bottom number of a fraction is called the denominator.
What does the denominator represent?
The whole
200

Which artist has 18 #1s?
Mariah Carey
200

Which class was attended by the fewest kids?
Jazz
200

Which day did they sell 90 tickets?
Day 2
200
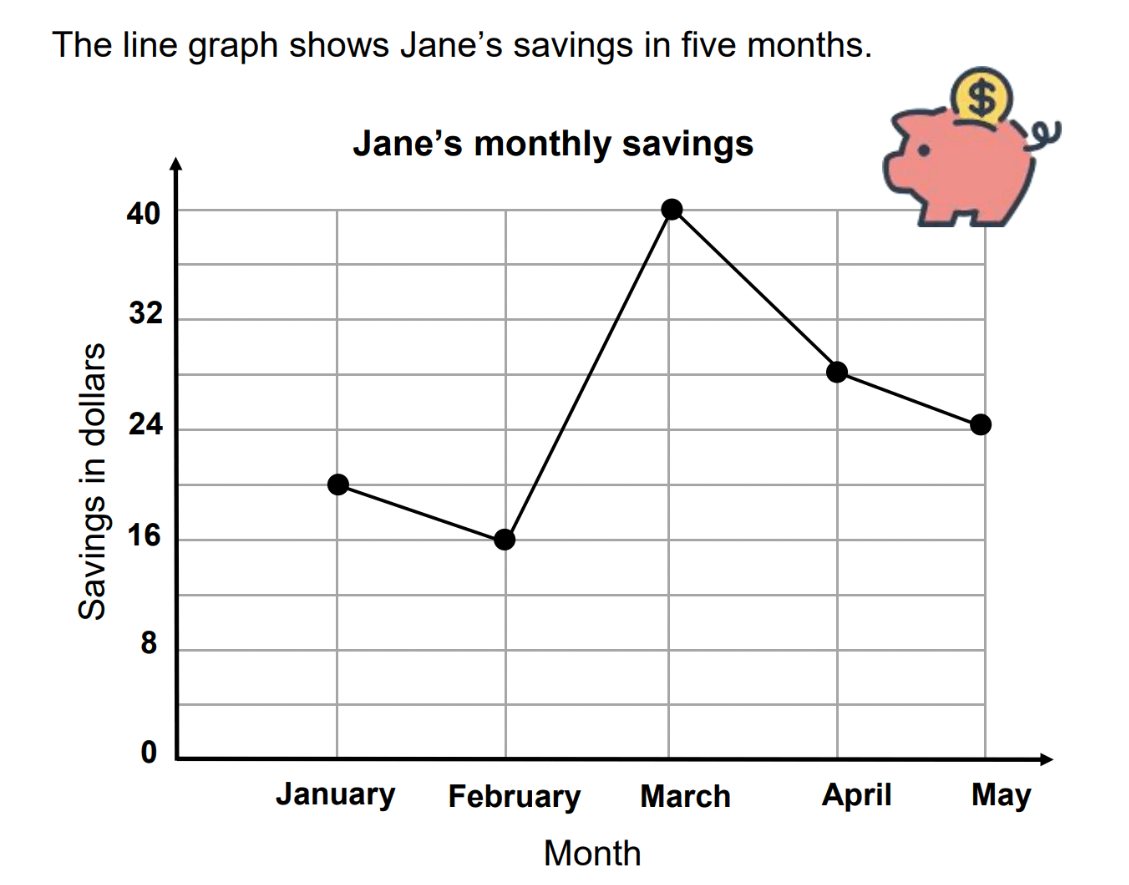
How much less did Jane save in May that in April?
$4
200
What is 0.743 as a percentage?
74%
300

How many computers were sold in Shop B and D?
35
300

What fraction or percentage of the kids attended ballet class?
1/4 or 25%
300

Did the shop sell more cups of tea on week 1 or 2? _
Week 2
300
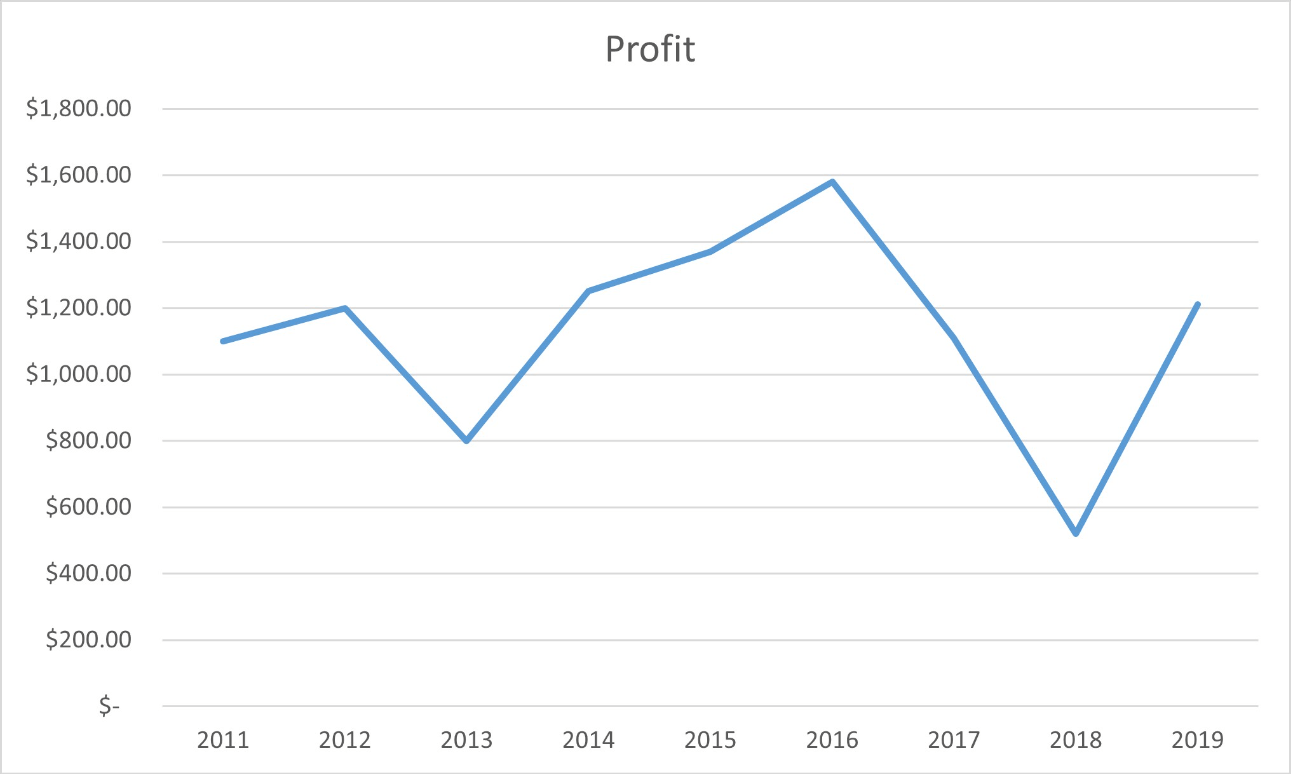
What happened to profits between 2012 and 2013?
Profits went down (by $400)
300
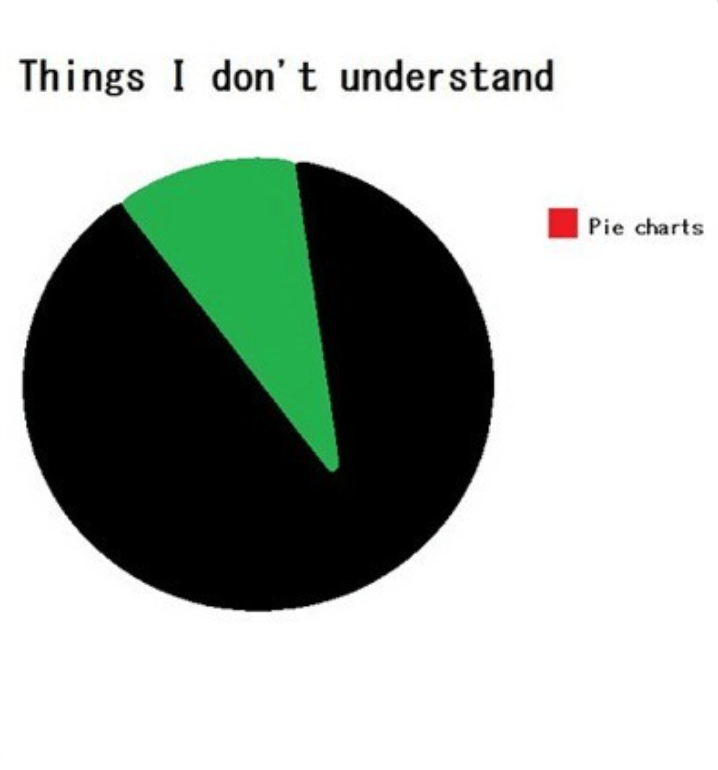
What don't I understand?
Pie charts
400
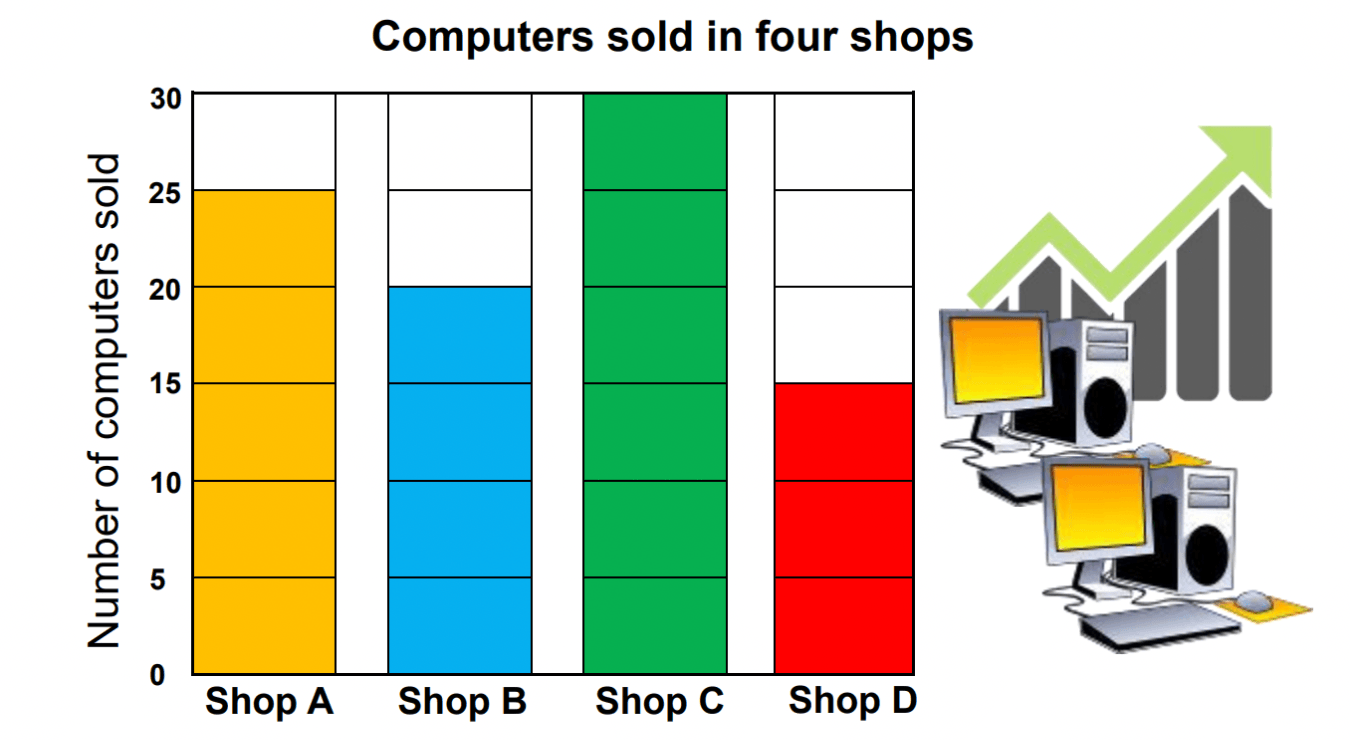
Which shops together sold exactly 40 computers?
Shop A and D
400

What ethnicity has the third largest section?
White
400

Which week did they sell more than 520 cups of tea?
Week 4
400

What is the difference in profits between the highest and lowest years?
$900
400
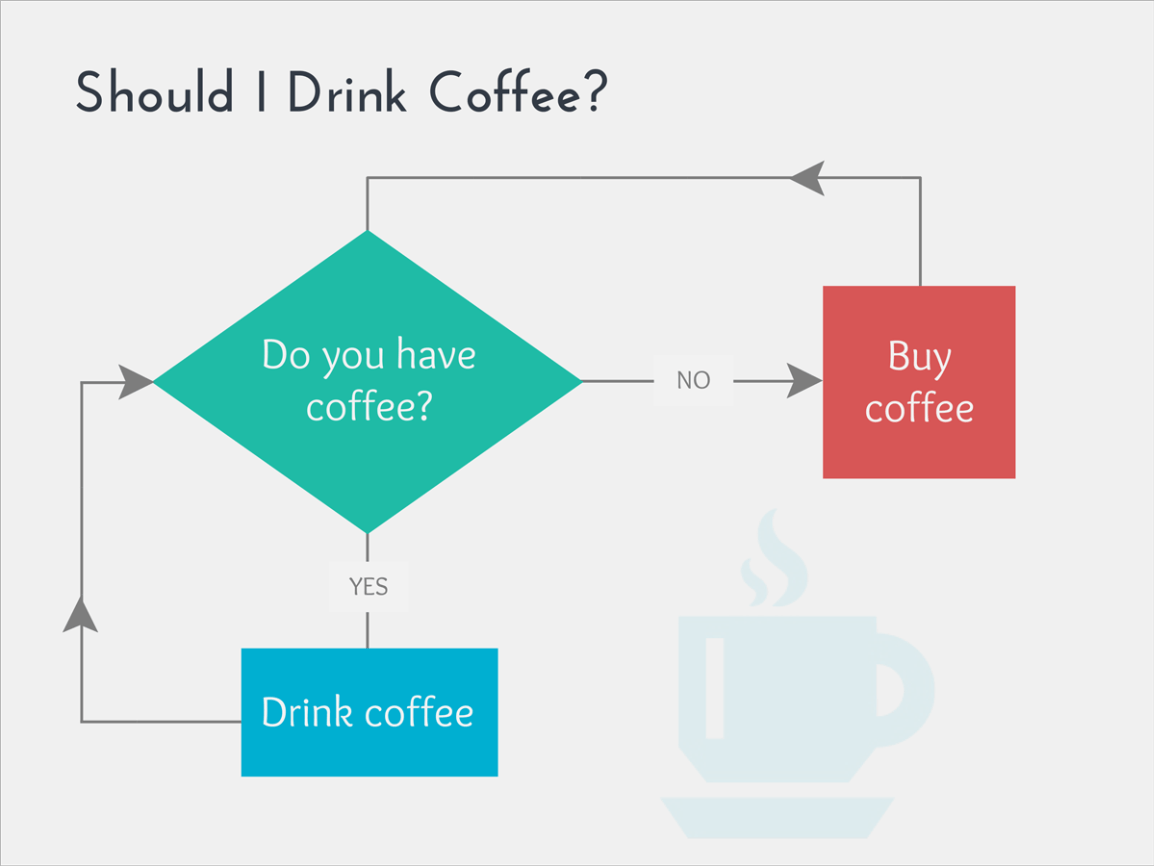
Should I drink coffee?
Yes
500
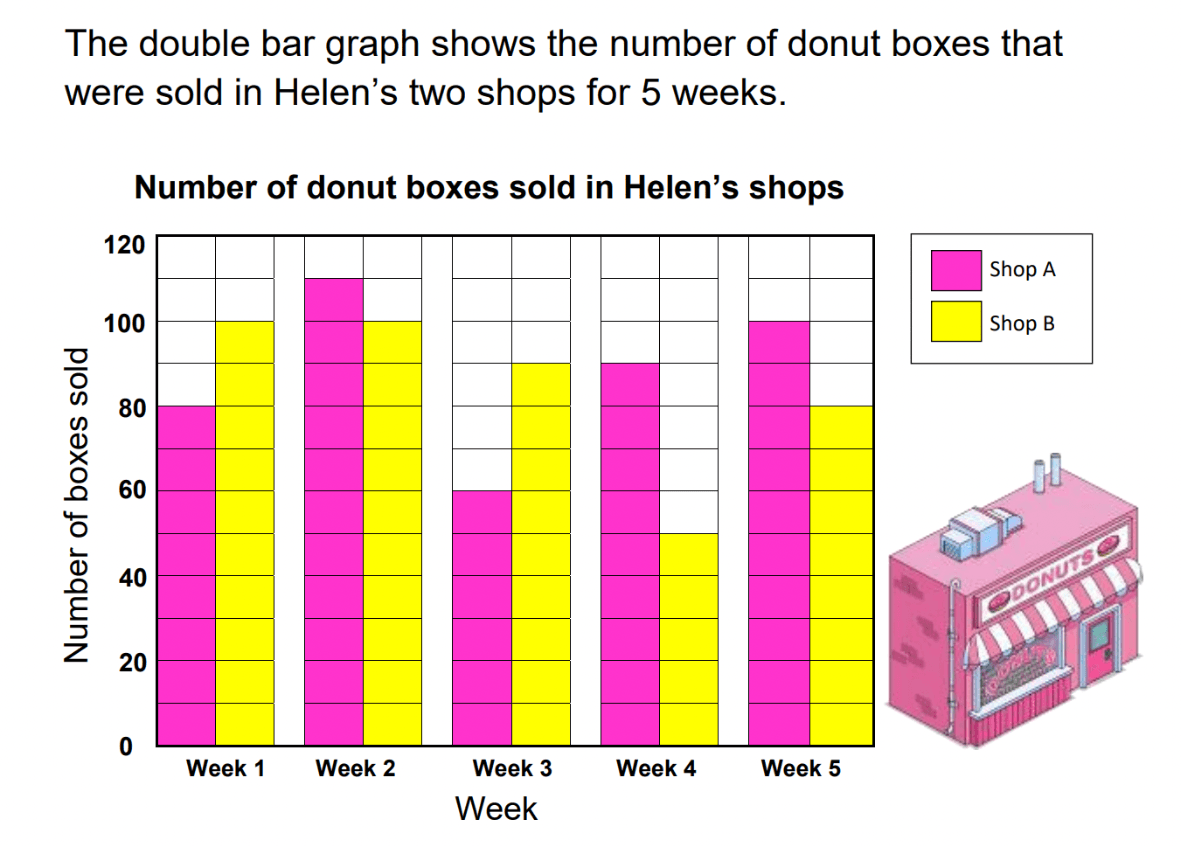
Which two weeks did she sell the same total number of boxes?
Weeks 1 and 5
500

Does A, B, or C have section 1 as the largest?
C
500

About how many Britons are from Wales?
About 3 million
500
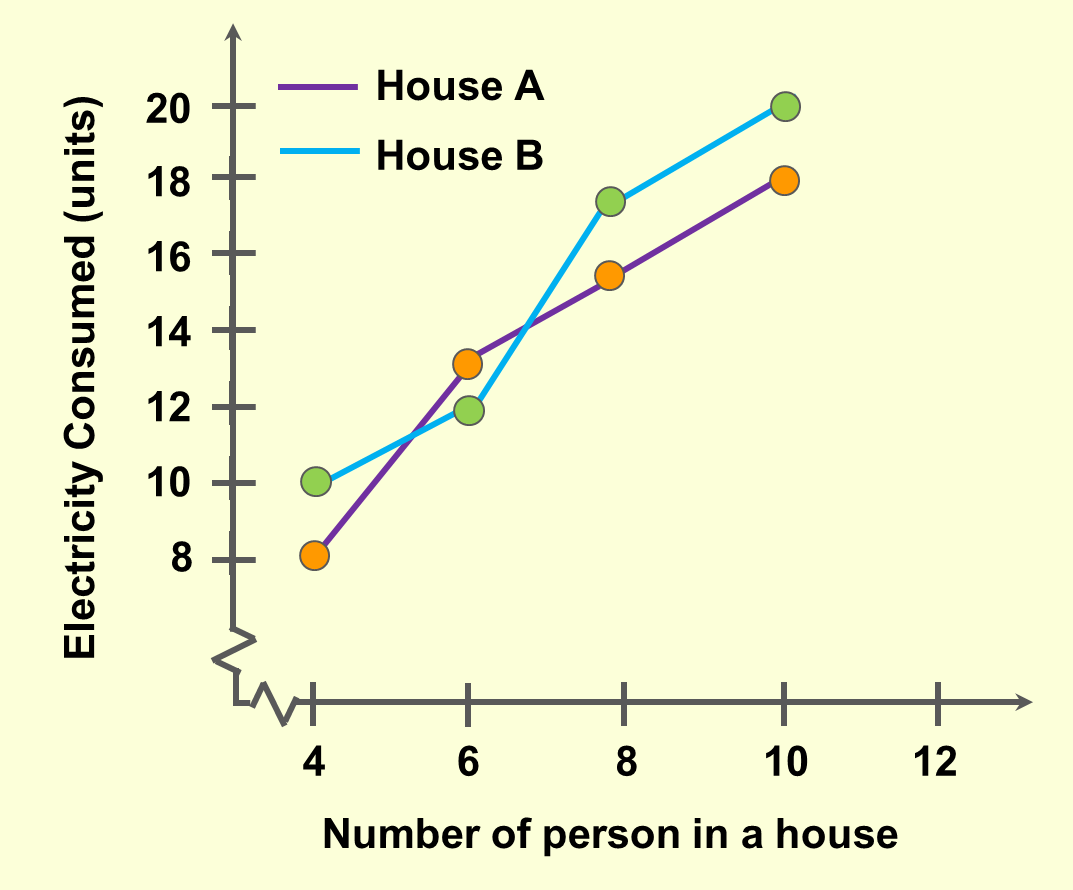
What is the relationship between electricity consumed and the number of people in a house?
More electricity is used when there are more people in the house
500
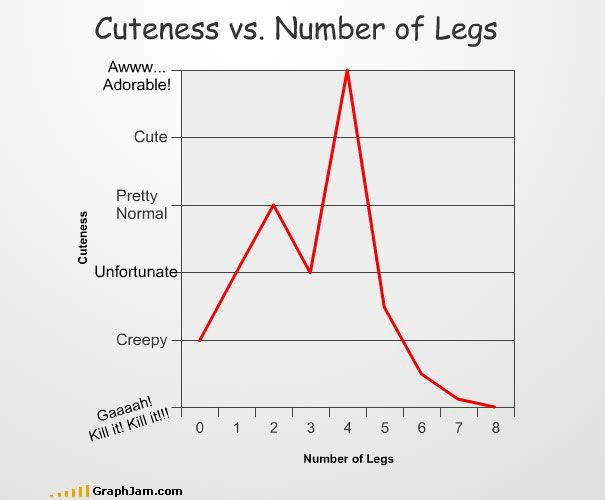
What does this tell us about number of legs?
not enough or too many is not cute