How many total miles did the car travel?
200

How many students like baseball the best?
6 people
Cual es el nombre de la Sra. V?
Liliana

What is the frequency of students who have 5 siblings?
1 student

What percent of people like PIZZA?
100%

How much more rain fell in Feb of 1990 than in Feb of 1989?
2

How many total people completed the survey?
29 people
Cuantos hijos tiene?
1

What is the frequency of students with two siblings?
6

This circle graph represents a classroom of 20 students. How many students chose pepperoni pizza?
10 students

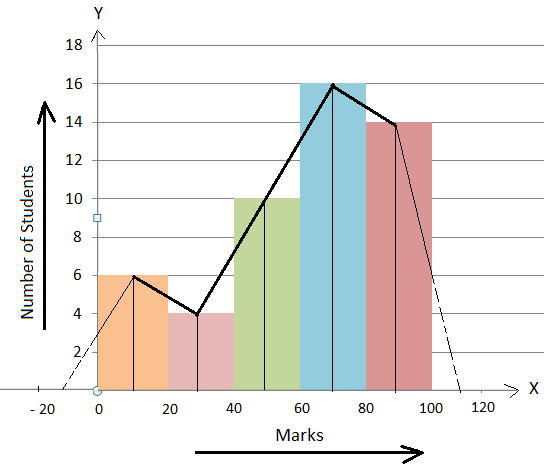
How many students scored 40 marks or below?
10 students

How many more students like Soccer than Basketball?
9 - 7 = 2 students
Como se llama la hija de Sra. V?
Emily

What is the RANGE of siblings?
5 - 0 = 5
The range is 5 siblings

This circle graph represents a class of 20 people. How many people chose CHEESE pizza?
5 people
 Which method of music sales has increased AND decreased over time?
Downloads

What is the most favorite sport?
SOCCER
Cuantos perros tiene?
3

What is the MODE for this data?
2 Siblings is the mode (the most common score)

This circle graph represents 20 people. How many more people chose pepperoni compared to cheese?
10-5 = 5 students

Which year had the most rainfall?
1989:4+2+6+8+6+2=28
1990:2+4+2+6+4+8=26

How many people picked a favourite sport that is played on a court?
12 people
Basketball and Tennis are played on courts, the others are played on fields or pitches
Donde vive? Que pueblo?
Huntington

How many students have 3 or more siblings?
7 students
 What percentage of people preferred meat based pizzas?
50 + 15 + 10 = 75%