Mixed bag Graphs
Bar Graphs
Dot Plots
Frequency Histograms
Pie Chart Graphs
100

Which was the least favorite sport?
Ice Hockey
100

How many students like baseball the best?
6 people
100

What is the MODE?
5
100

What is the frequency of students who have 5 siblings?
1 student
100

What percent of people like PIZZA?
100%
200

What percentage of people liked grapes and bananas?
57%
200
How many total people completed the survey?
Clue: you must add the totals of all sports 9+7+5+2+6=
29 people
200
What is the MEDIAN?
5
200
What is the frequency of students with two siblings?
6
200

This circle graph represents a classroom of 20 students. How many students chose pepperoni pizza?
10 students
300
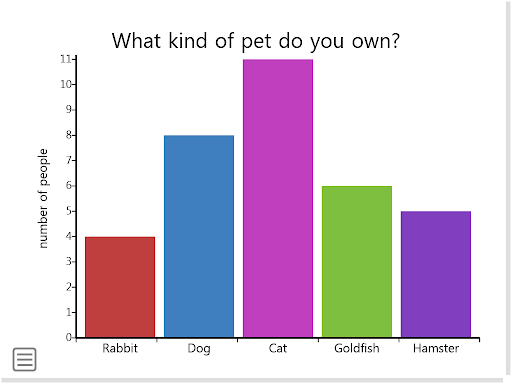
How many students own dogs?
8 students
300
How many more students like Soccer than Basketball?
9 - 7 = 2 students
300
What is the RANGE?
begins at 3 ends at 7 (subtract 7-3=)
7 - 3 = 4
300
What is the RANGE of siblings?
clue:5 - 0 =
5 - 0 = 5
The range is 5 siblings
300
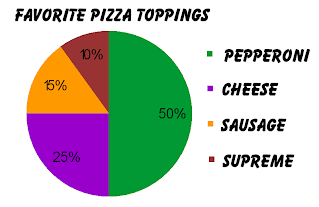
This circle graph represents a class of 20 people. How many people chose CHEESE pizza?
5 people
400
What percentage of students liked hockey? (round to the nearest whole percent)
7%
400
What is the mean of this graph? (Round to the first decimal place)
5.1
400
What is the MODE for this data?
clue: most common score (highest frequency)
2 Siblings is the mode (the most common score)
400
 This circle graph represents 20 people. How many more people chose pepperoni compared to cheese?
10-5 = 5 students
500

Which dot plot has the larger median?
Video Games
Exercise Median = 2.5
Video Games Median = 9
500
How many people picked a favorite sport that is played on a court? clue: tennis and basketball are played on a court.
12 people
Basketball and Tennis are played on courts, the others are played on fields or pitches
500
Is this graph faily symmetric?
Yes, Symmetric
500
How many students have 3 or more siblings?
7 students
500
 What percentage of people preferred meat based pizzas?
50 + 15 + 10 = 75%