Which was the least favorite sport?
Ice Hockey

How many students like baseball the best?
6 people
Joey left the house for school at 7:35 am. He returned home at 9:35 am. How many hours was he at school?
what is 2 hours?

What is the frequency of students who have 5 siblings?
1 student

What percent of people like PIZZA?
100%

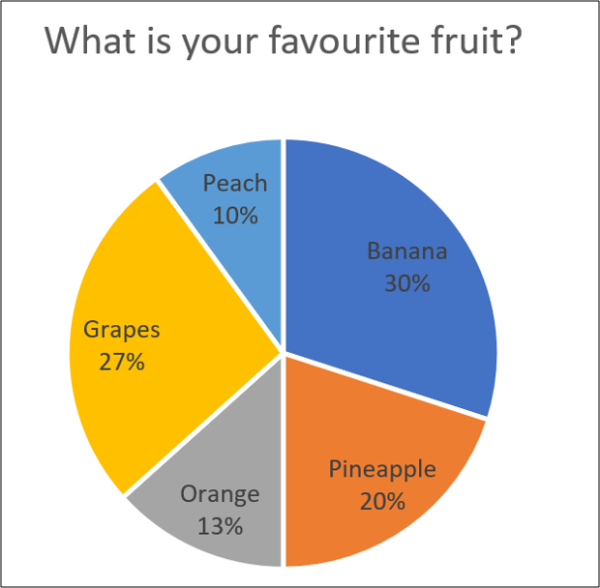
What percentage of people liked grapes and bananas?
57%

How many total people completed the survey?
29 people
What time does the clock show?
11:05

What is the frequency of students with two siblings?
6
10 students
563+ 100=
What is 663?

How many more students like Soccer than Basketball?
9 - 7 = 2 students

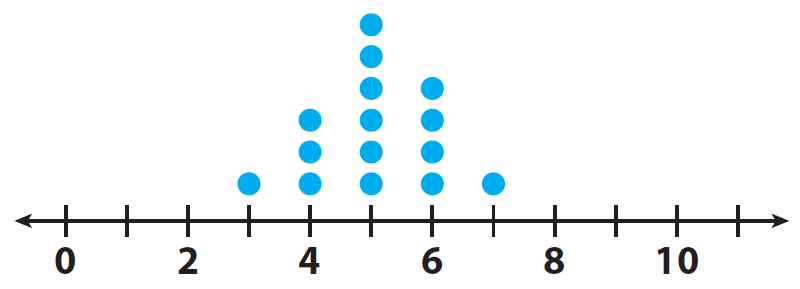
What is the RANGE?
7 - 3 = 4

What is the RANGE of siblings?
5 - 0 = 5
The range is 5 siblings

How many students played Soccer and Hockey?
What is 11?

What is the most favorite sport?
SOCCER
What time does the clock below show?
What is 6 O'clock

What is the MODE for this data?
2 Siblings is the mode (the most common score)

This circle graph represents 20 people. How many more people chose pepperoni compared to cheese?
10-5 = 5 students
what is 3+3+3=
What is 9 ?

How many people picked a favorite sport that is played on a court?
12 people
Basketball and Tennis are played on courts, the others are played on fields or pitches
The bus left the terminal at 4:50 pm and arrived to its destination at 6:05 pm. How long was the trip?
What is 1 hr 15 minutes?

How many students have 3 or more siblings?
7 students
 What percentage of people preferred meat based pizzas?
50 + 15 + 10 = 75%