Reading Histograms
Histogram Vocab
Frequency Tables
Other Vocab
100
How many lottery winners were between 50-59 years old?

8
100
Data that is catagorical
Qualitative Data
100
How many people got between an 80-119?

12
100
In y=mx+b, what does the b represent
y-intercept
200
How many lottery winners were at least 60 years old?
9
200
How often a piece of data occurs.
What is Frequency?
200
How many people take a car to school?

16 people
200
give three other terms that mean the same thing as solutions for a quadratic.
Roots, Zeros and X-Intercepts
300
The histogram below represents peoples test scores. How many people took the test?

18
300
The chart used to organize data for a histogram.
Frequency Table
300
How many total people were surveyed?
what is 31?
300
Another name for the average rate of change
Slope
400
How many lottery winners were 39 years old or younger?
7
400
A description of a Histogram that has a tail to the right
What is Skewed Right?
400
How many students scored below 160?
26 students
400
What is it called when you write terms in order from largest exponent to constant
Standard Form
500
What is the most common age group?
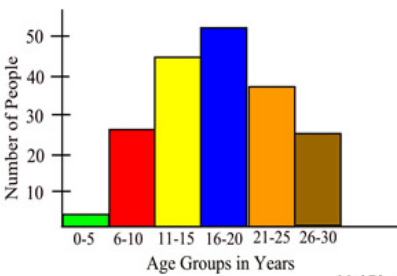
16-20
500
A Histogram in which the height of the bars are similar.
What is Uniform?
500
What percent of students to the nearest tenth
scored above 119
41.9%
500
The number you multiply by to get to the next term for an exponential function
A Common Ratio