Reading Histograms
Histogrizzles
Frequency Tables & More
Histogrizzams
100
How many lottery winners were between 50-59 years old?

8
100
How many items cost $10 or less?
20
100
How many people got between an 80-119?

12
100
How many people were above 169.5 cm tall?

8 people
200
How many lottery winners were at least 60 years old?
9
200
Which data range had the lowest frequency?

0-20
200
How many people take a car to school?

16 people
200
How many students scored between 71-80 on their exam?

80
300
The histogram below represents peoples test scores. How many people took the test?

18
300
How many black cherry trees were at least 75 feet tall?

17 trees
300
How many students scored between 70-79?

3
300
Did people spend more than 30 minutes or less than 30 minutes on average each day?
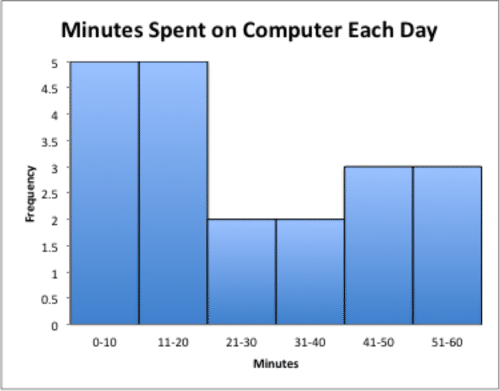
Less than 30 minutes
400
How many lottery winners were 39 years old or younger?
7
400
How many people scored between 60-70% on the English test?
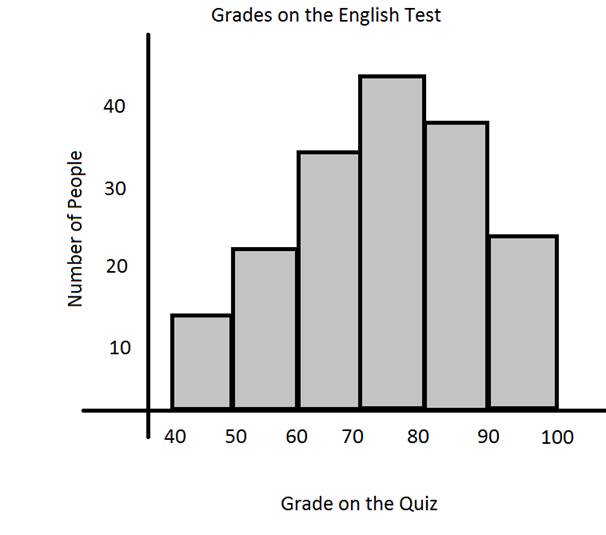
35
400
How many students scored an 80 or higher?
13 students
400
How many students earned less than $100 per week?
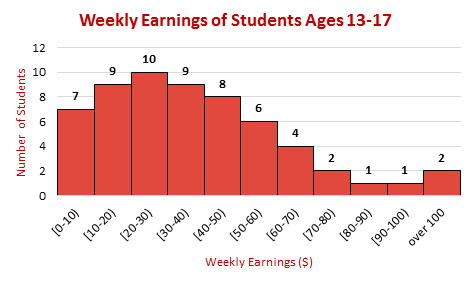
57
500
What is the most common age group?
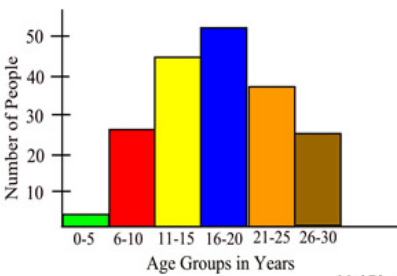
16-20
500
What was the most frequent mark that students received on their tests?
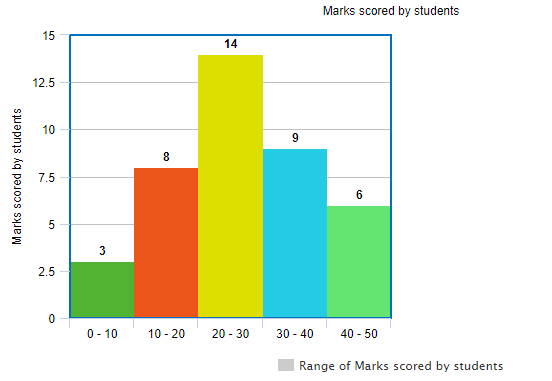
20-30
500
If 100 people were surveyed, how many chose action?

25 people
500
Which age group loves MnM's the LEAST?
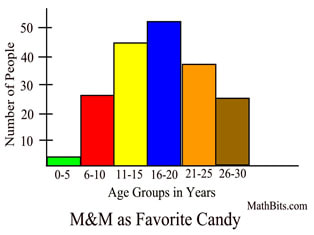
0-5