Unit 0 - Prerequisite Skills
Unit 1 - Analyze Graphs and Expressions
Unit 2 - Create and Solve Equations and Inequalities
Unit 3 - Systems of Equations
Unit 4 - Descriptive Statistics
Unit 5 - Bivariate Data
100
Which operation undoes multiplication?
Division
100
Which property is demonstrated here?
(xy)z=x(yz)
Associative Property
100
What does this symbol represent?
RR
All Real Numbers
100
True or False: This equation is written in standard form.
3x-5y=8
True
100
Which calculator button allows you to begin entering a list of data?
STAT
100
To the nearest whole number, what percentage of boys prefer dogs?
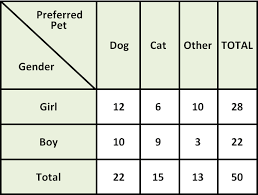
About 45%
200
Solve for x:
3x-6=12
x=6
200
Simplify:
3+5(x-8)
5x-37
200
What does this represent?
{ }
No Solution or Empty Set
200
Would we shade this inequality above or below the graphed line?
y<3x-8
Below
200
What is the range of the data?
{2, 5, 9, 10, 14, 18, 23}
21
200
To the nearest whole number, what percentage of cat lovers are girls?

40%
300
Solve for x:
2/x=3/6
x=4
300
True or False:
x-7=7-x
False
300
Solve:
2(x+5)=2x+10
All Real Numbers or Infinitely Many Solutions
300
Would the graphed line be dashed or solid?
y>=-7x-4
Solid
300
What type of distribution is shown?
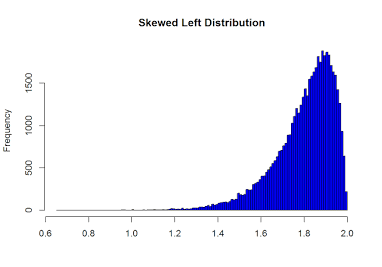
Skewed left
300
If the actual value is 30 and the predicted value is 27, what is the residual value?
3
400
What is the slope of
y=2-5x
m=-5
400
Multiply and simplify:
(x+1)(x-1)
x^2-1
400
Solve the inequality:
-x>-7
x<7
400
True or False: If we graph two linear equations and they intersect, their point of intersection is the solution to the system of equations.
True
400
True or False: The mean is always less than the median.
False
400
Describe the correlation.
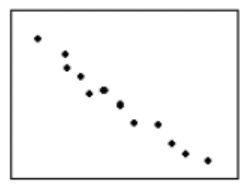
Strong Negative
500
What is the equation of this line?
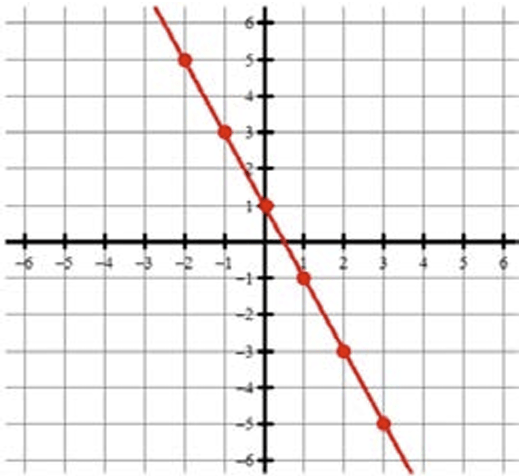
y=-2x+1
500
Multiply and simplify:
(x-3)^2
x^2-6x+9
500
Find the excluded value(s) of
3/x=9/2
x!=0
500
If a system of equations results in 2 parallel lines, what is the solution?
No Solution -- the lines never meet
500
What is included in the 5 Number Summary of a Box Plot?
Minimum, Q1, Median, Q3, and Maximum
500
To generate a scatter plot on your TI-84, what must be turned on?
Stat Plots