Dot Plots
Box and Whisker Plots
Reading
Box and Whisker
Box and Whisker
100
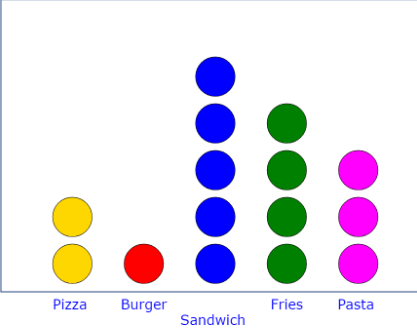
How many people prefer to eat fries?
a. 3 people
b. 4 people
c. 1 person
d. 2 people
b. 4 people
100
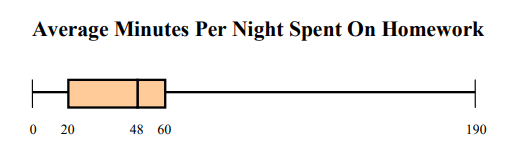
What is the shape of the box and whisker plot?
a. normal distrubution
b. bell-shaped
c. skewed right
d. skewed left
c. skewed right
100
What is the Median?
17
200
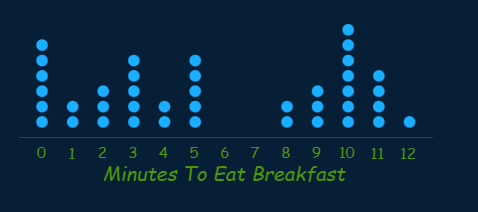 How many students ate breakfast in 10 minutes?
a. 5 students
b. 8 students
c. 7 students
d. 9 students
c. 7 students
200
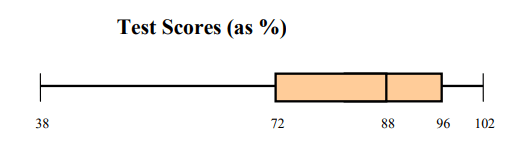
What is the median for the box and whisker plot?
a. 102
b. 38
c. 96
d. 88
d. 88
200
What is the Maximum?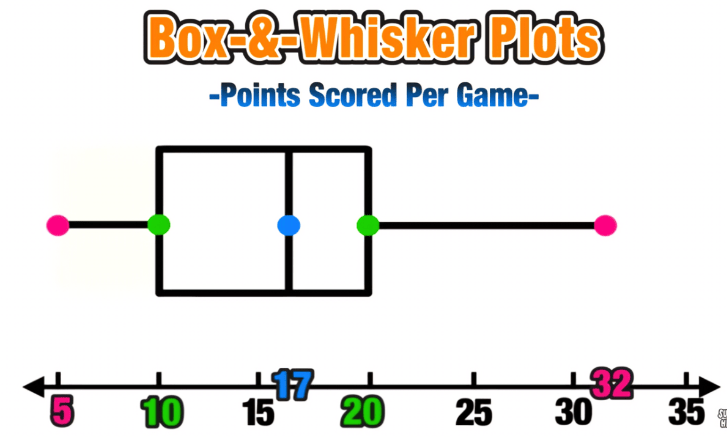
32
300
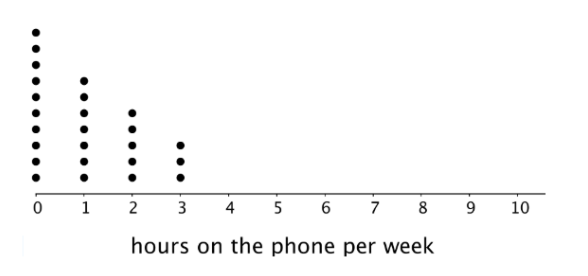
How many teenagers were on their phone for at least 2 hours?
a. 8 teenagers
b. 5 teenagers
c. 9 teenagers
d. 3 teenagers
a. 8 teenagers
300
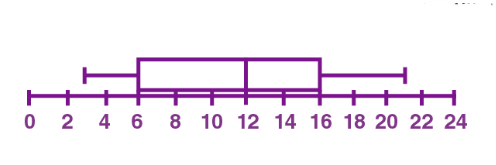
Which values are quartile 1 and quartile 3?
a. 3 & 6
b. 3 &16
c. 6 & 12
d. 6 & 16
d. 6 & 16
300
What is the minimum?
5
400
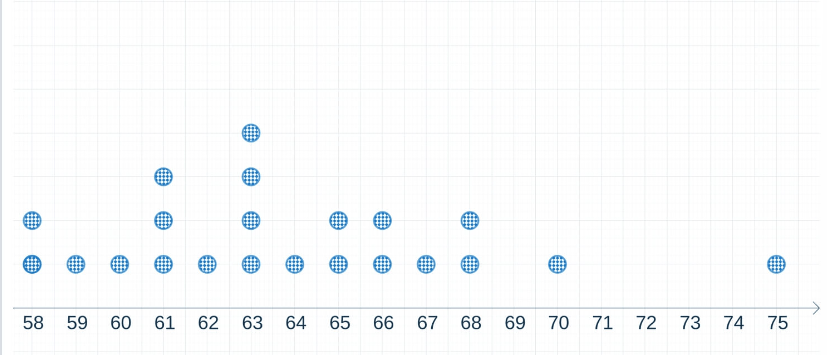 What is the shape of the distribution?
a. skewed left
b. skewed right
c. skewed
d. approximately normal
b. skewed right
400
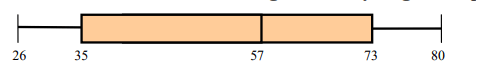
What is the range of the box and whisker plot?
a. 73
b. 106
c. 54
d. 35
c. 54
400
What is Q1 (Quartile 1)?
10
500
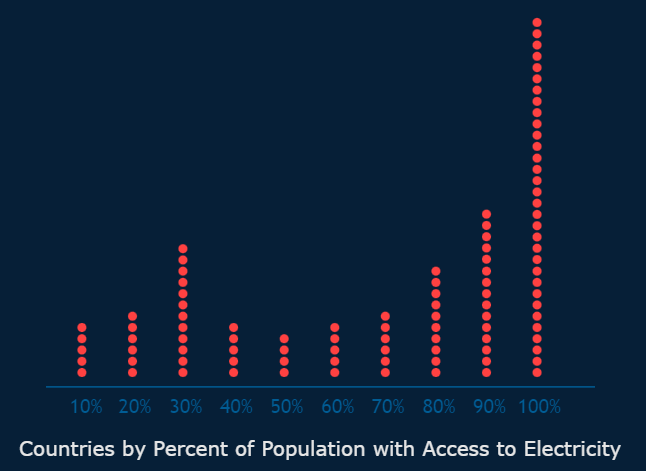 How many countries have access to electricity with at LEAST 100%?
a. 21 countries
b. 52 countries
c. 30 countries
d. 32 countries
d. 32 countries
500
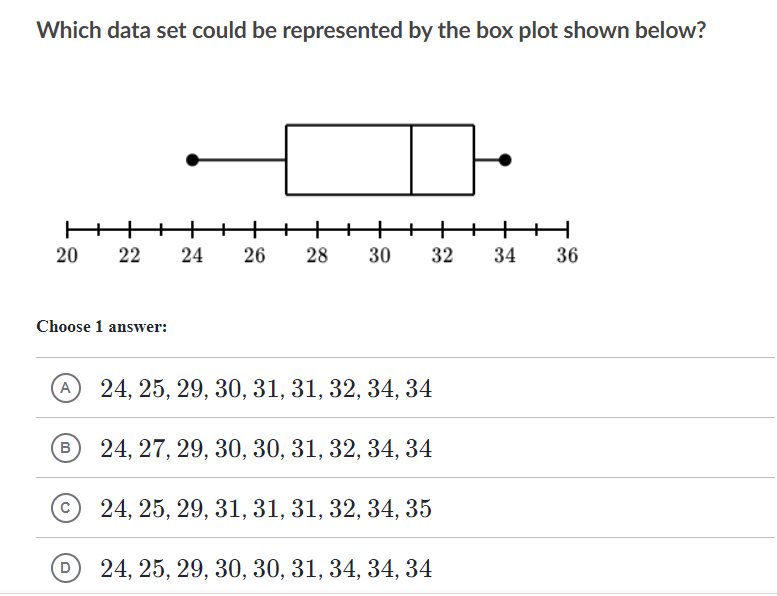
A. 24, 25, 29, 30, 31, 31, 32, 34, 34
500
What is Q3 (Quartile 3)?

20