Dot Plots
Histograms
Box and Whisker Plots
Random Values
Reading
Box and Whisker
Box and Whisker
100
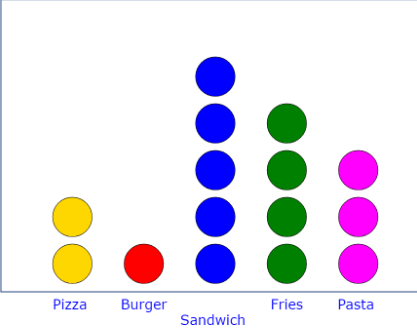
How many people prefer to eat fries?
a. 3 people
b. 4 people
c. 1 person
d. 2 people
b. 4 people
100

How many people in the 16-20 age group likes M&Ms?
a. 50
b. 45
c. 25
d. 30
a. 50
100
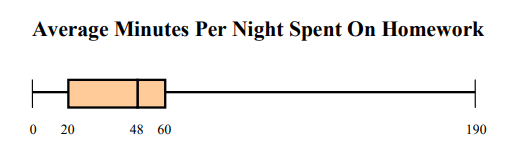
What is the median?
a. 190
b. 20
c. 48
d. 60
c. 48
100
What is the maximum in this data value?
10, 33, 14, 15, 21, 16, 21, 22, 7
33
100
What is the Median?
17
200
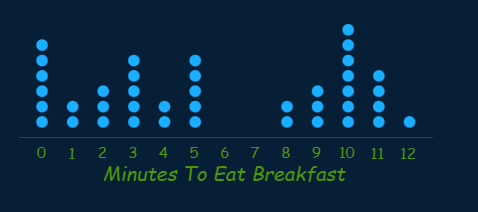 How many students ate breakfast in 10 minutes?
a. 5 students
b. 8 students
c. 7 students
d. 9 students
c. 7 students
200
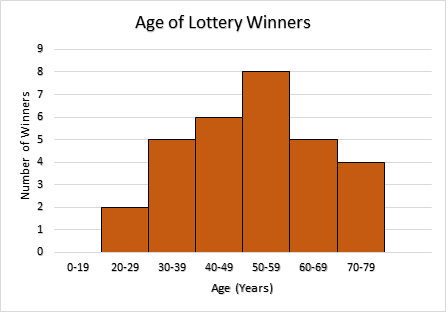
How many winners are at most 49 years old?
a. 8
b. 17
c. 13
d. 30
c. 13
200
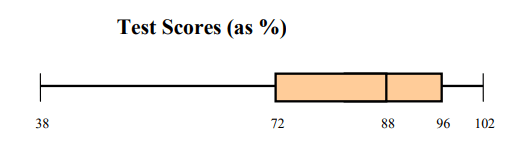
What is the median for the box and whisker plot?
a. 102
b. 38
c. 96
d. 88
d. 88
200
91 95 54 69 80 85 88 73 71 70 66 90 86 84 73
The median of this data set (n=15) is 73.
(True or False?)
False
200
What is the Maximum?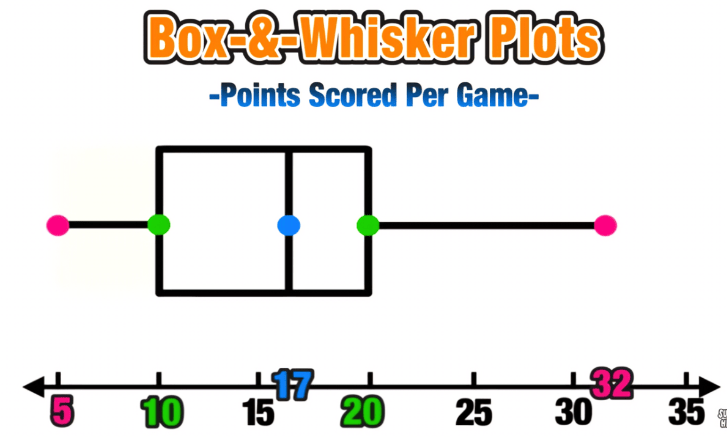
32
300
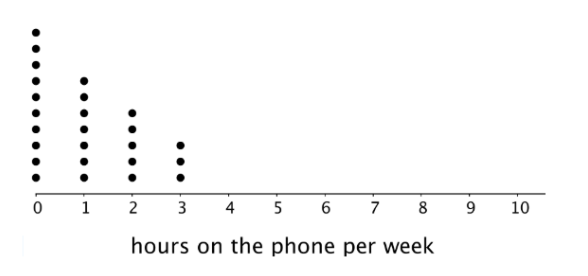
How many teenagers were on their phone for at least 2 hours?
a. 8 teenagers
b. 5 teenagers
c. 9 teenagers
d. 3 teenagers
a. 8 teenagers
300

Is this a histogram?
(Yes or No?)
No, the bars need to be side-by-side
300
Which values are Q1 and Q3?
a. 3 & 6
b. 3 &16
c. 6 & 12
d. 6 & 16
d. 6 & 16
300
99; 56; 78; 55.5; 32; 90; 80; 81; 56; 59; 45; 77; 84.5; 84; 70; 72; 68; 32; 79; 90
What is the median of the data value set?
74.5
300
What is the minimum?
5
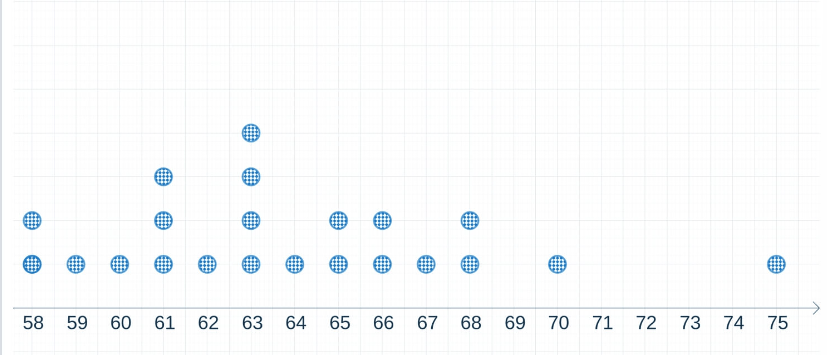 What is the mode of the data?
400

Which score range did 13 students receive on their exams?
51-60
400
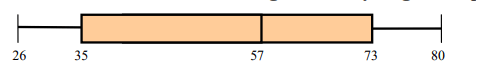
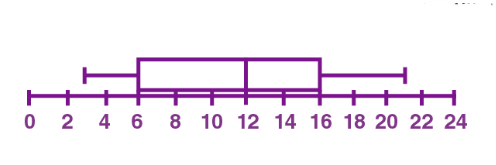
What is the range of the box and whisker plot?
a. 73
b. 106
c. 54
d. 35
c. 54
400
![]()
What is the median, and Q1 of these data values?
79 and 69
400
What is Q1 (Quartile 1)?
10
500
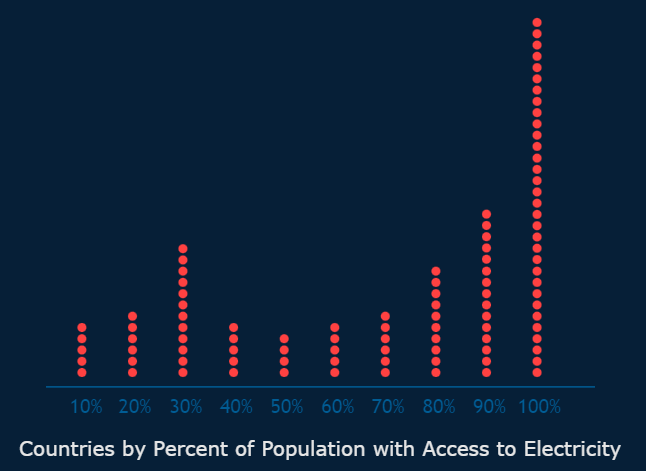 How many countries have access to electricity with at LEAST 100%?
a. 21 countries
b. 52 countries
c. 30 countries
d. 32 countries
d. 32 countries
500
What are intervals?
a. data points that are in sections with equal length
b. how fast you can run.
c. a slice on a pie chart
a. data points that are in sections with equal width.
500
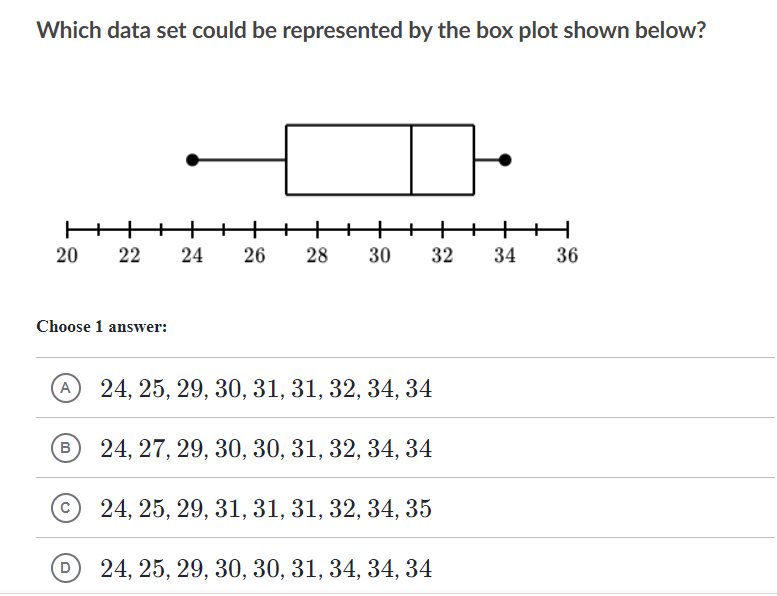
A. 24, 25, 29, 30, 31, 31, 32, 34, 34
500
20, 120, 160, 200, 210, 250, 290, 350, 380, 460, 510 580
What is the maximum, minimum, and range of these data values?
maximum - 580
minimum - 20
range - 560
500
What percent of the points were scored between 17-32?

50%