Graphs
Adding
Subtracting
100
The bar graph shows state in which 2nd Grade students were born.

How many students were born in Connecticut?
4 students
100
4 + 9 =
13
100
10 - 4 =
6
200
The bar graph shows the colors of flowers in Noah's Garden.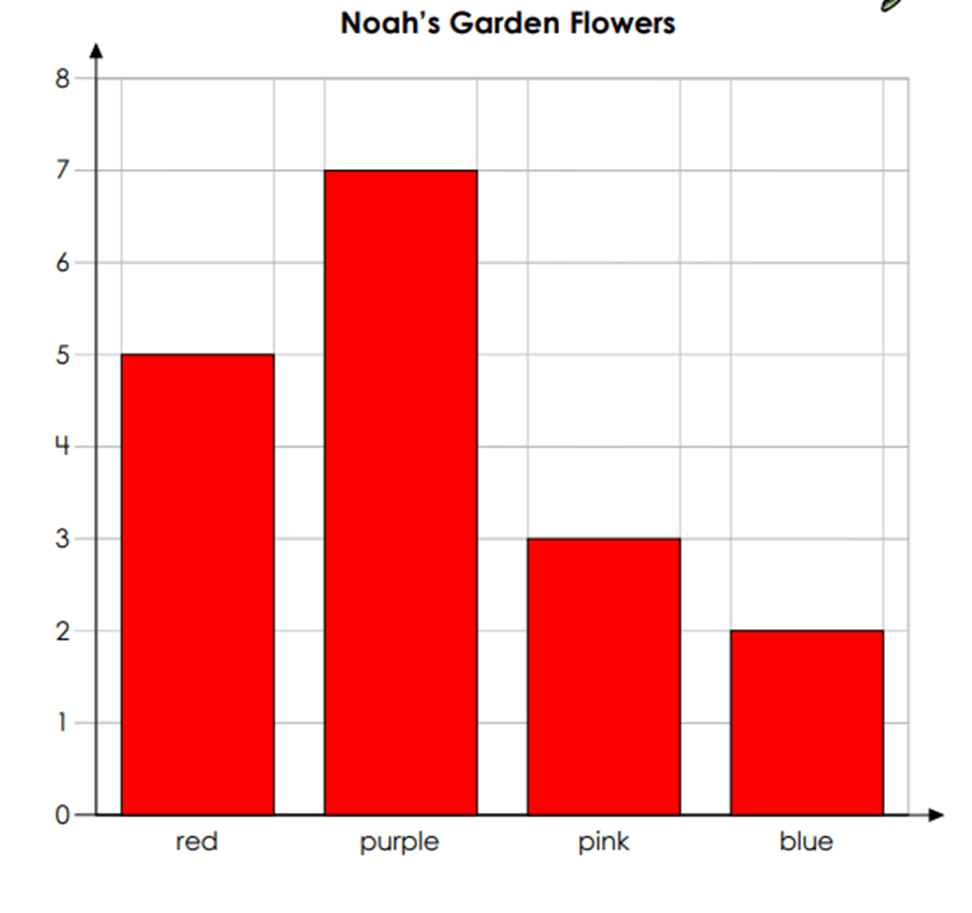
How many total flowers are RED or PURPLE?
5 + 7 = 12
200
___ + 7 = 10
3
200
20 - ____ = 11
9
300
The bar graph shows the number of different color sheets of paper on a desk.
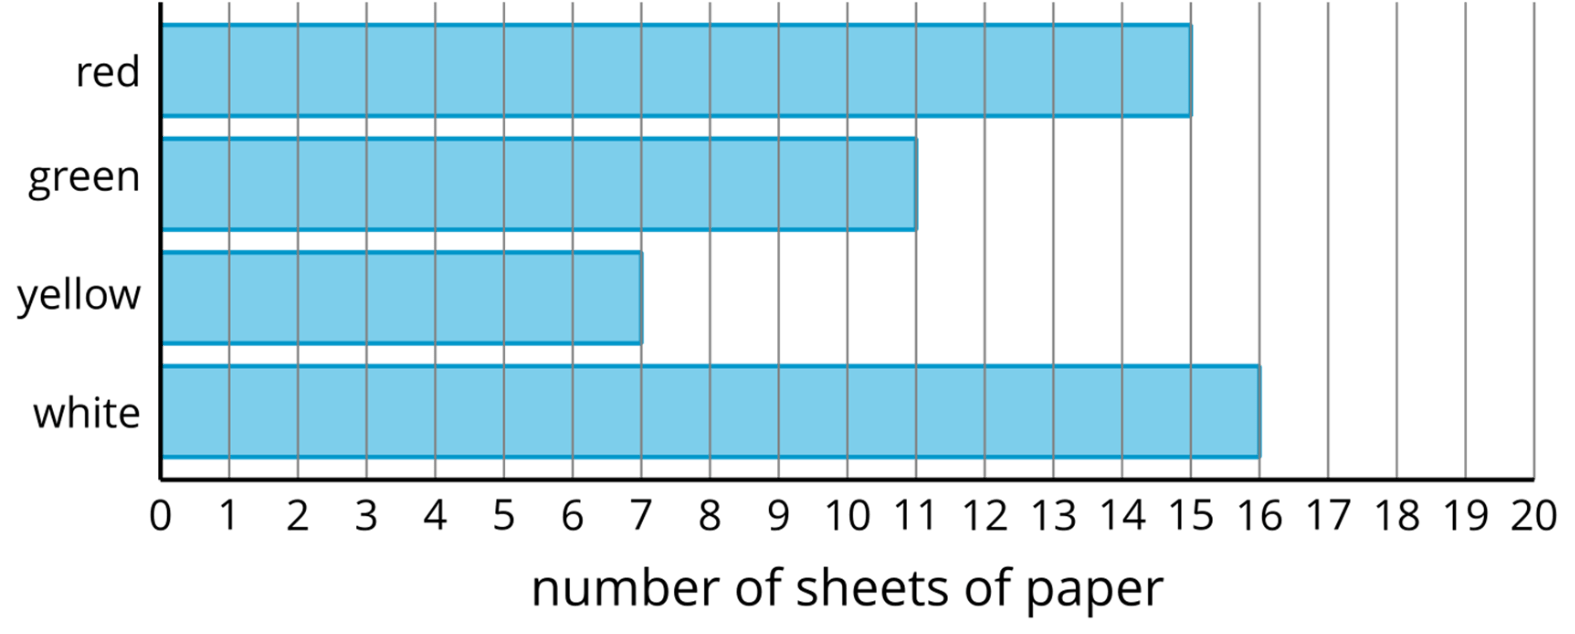
How many more sheets of white paper are there than yellow?
16-7 = 9
There are 9 more sheets of white paper than there are yellow paper.
300
4 + ___ = 20
16
300
10 - ___ = 2
8
400
The bar graph shows the states where the students in a second-grade class were born.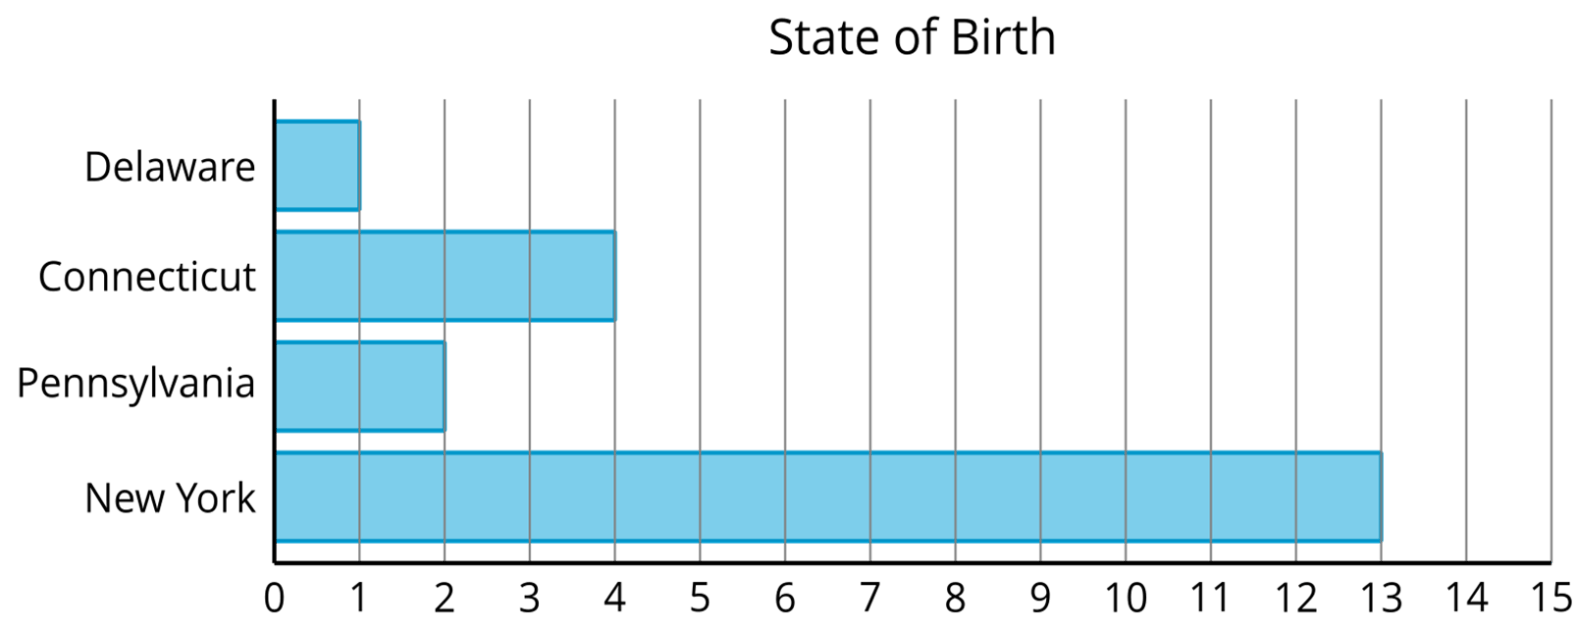
How many less students were born in Delaware than in Connecticut?
4 - 1 = 3
3 fewer students were born in Delaware than in Connecticut.
400
15 + 5 =
20
400
18 - 13 =
5
500
The second-grade students at a school chose their favorite summer fruit. The graph shows some of their choices.
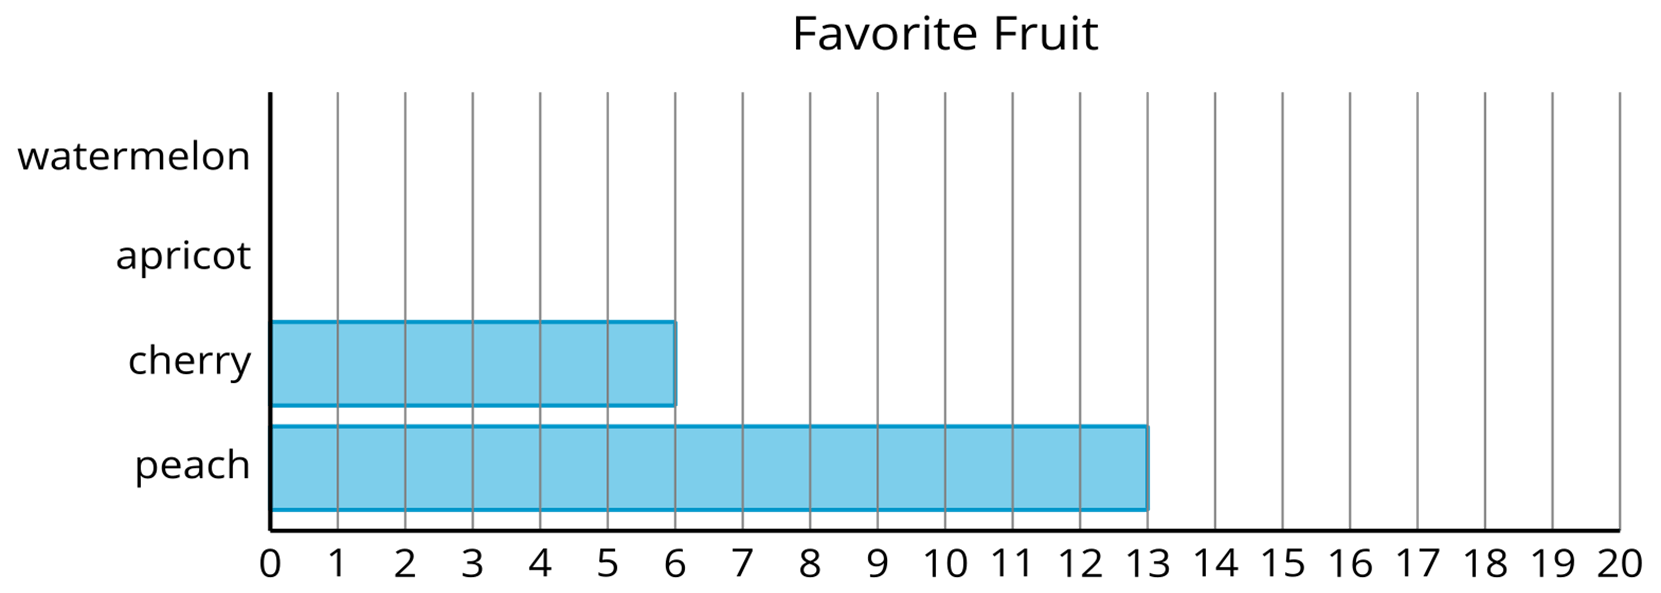
How many total students voted?
How many total students voted?
5 + 1+ 6 + 13= 25
500
Some kids were waiting to buy ice cream from an ice cream truck. 6 kids bought ice cream sandwiches and 7 kids bought push-ups.
How many kids bought ice cream altogether?
13
500
A farmer has 66 chickens on her farm. 14 chickens leave the farm to go live somewhere else.
How many chickens does the farmer still have on his farm?
66-14= 52
Farmer John has 52 chickens left on his farm.