IM U7 L11
Ordered Pairs
Ordered Pairs
Name the ordered pair.
Name the point that is plotted on the graph.
(0,0) or the Origin
The horizontal axis is known as the ______ axis.
x axis

At 6pm, what was the temperature?
It was +2 degrees.
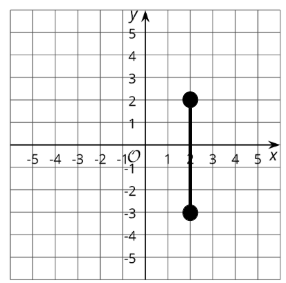
What is the length of this line segment?
5 units
A (0,4) B (3,4) C (3,1) D (0,1)
What kind of quadrilateral is this polygon?
A Square
 Name the ordered pair and the quadrant it is in.
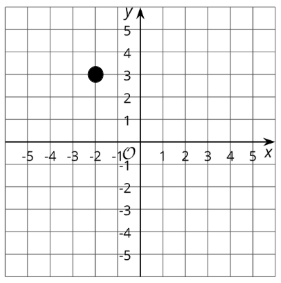
(-2, 3) Quadrant II
The vertical axis is known as the _____ axis.
y axis
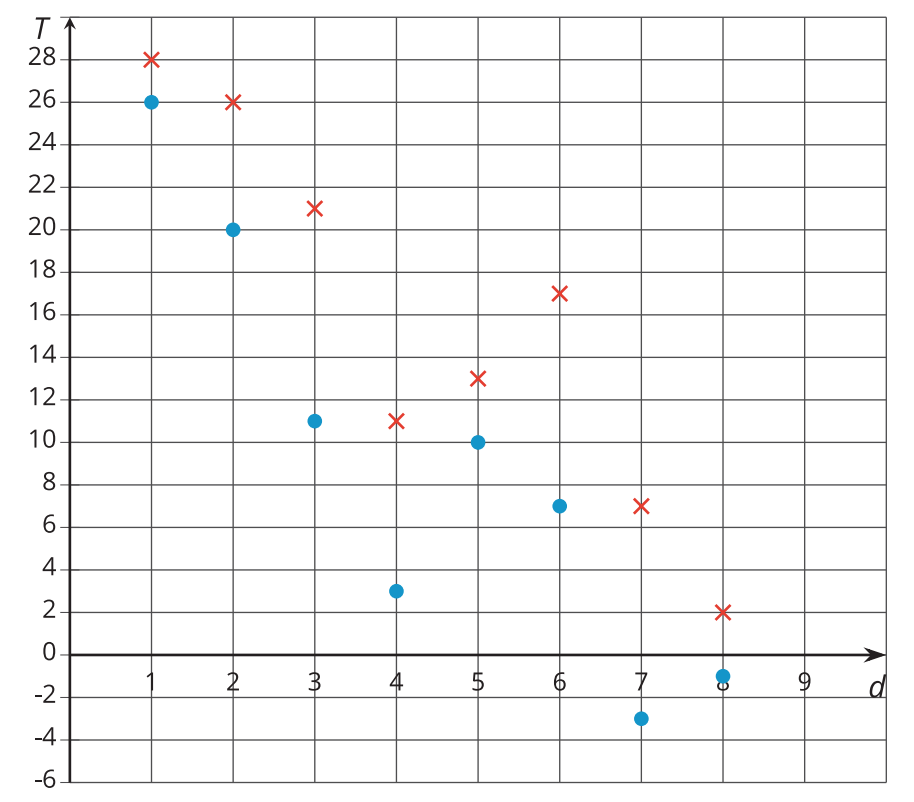
On what days does Ted need to worry about the water in his RV pipes freezing? Temperature are in degrees Celsius.
He needs to worry on days 7 and 8 because the temperatures are below 0, the freezing point of water.
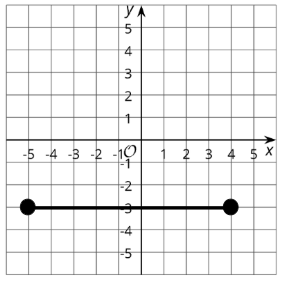
What is the length of this line segment?
9 units
A (0,4) B (3,4) C (3,1) D (0,1)
What is the perimeter of this polygon?
12 units
 Name the ordered pair and the quadrant of the point.
(5,-3) Quadrant IV (4)

What should your intervals be to fit this data set on your graph? (15, 50) (70, -45) (-50, 30) (-60, 60)
You should have an interval of 10 to fit the points on this graph.

After how many minutes was Steve at Sea Level?
After 3 minutes.
 What is the length of this line segment?
It is a diagonal line segment, you can not find the length by counting.
(Another possible answer) You can get from one point to the other by going 5 units up or down and 8 units across. So, it is 13 horizontal and vertical units away.

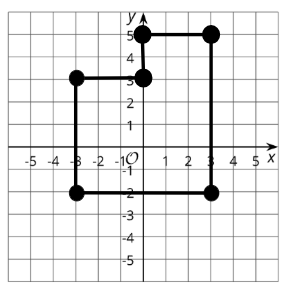
What is the perimeter of this polygon?
6 + 6 + 5 + 5 = 22 units
Describe how you know that an ordered pair will create a plotted point in Quadrant III?
A point will be plotted in Quadrant III if the first number (x) is negative and the second number (y) is also negative. ( - , - )

The x axis will be the quantity of each item. What is the largest number that needs to be placed on the x axis.
3000 (for straws)

What was the lowest recorded elevation on the graph?
-15 m
What is the distance between Point A (-7, 8) and point B (-7, -1) ?
It is 9 units long because -1 is 9 units away from 8 on a number line.
What is the Perimeter of this polygon?
26 units

Estimate the ordered pair for this point graphed on the coordinate plane above.
(2, 2.5) The y value can be anything in-between 2.25 and 2.75.
 What are the intervals of this graph?
The intervals on the x and y axis are 2. Each axis goes up and down by 2 units.

How much did the elevation change from the 2 minute mark until the final 11 minute mark.
45 meter change in elevation. (-5m up to 40m)
What is the distance between Point M (22, 10) and Point N (-90, 10)?
The distance is 112 units because 22 is 22 units to the Origin and then 90 units to -90. 22 + 90 = 112 units.
Point A (0,5) Point B (0,0)
Find two more ordered pairs that create a rectangle with a perimeter of 14 units.
Answer 1: (-2,5) and (-2,0)
Answer 2: (2,5) and (2,0)