Bar Graphs
Picture Graphs
Multiplication #1
Multiplication #2
Arrays
100
How many more people liked red than blue
1
100
Name at least two things a picture graph most contain
pictures
key
title
labels
scale
100
When you multiply we use rows and columns or ______ and ______
Groups and objects in the groups
100
4 x 10 = ?
solve
40
100
What has to be true to make an array
There has to be the same number of objects in each row and in each column. There does not have to be the same number of rows as there is columns.
200
What is the most popular fruit and least popular fruit
Most= Strawberries
Least= Pairs
200
What do you call the part of a scaled picture graph that will tell you the value of each picture
Key
200
2 X 5 = 10
What do you call the 2 and 5
Facotrs
200
2 X 5 = 10
What do you call the 10
the product
200
Show me or tell me what rows are and what columns are
Rows side to side like a movie theater
Columns up and down like the things that hold up buildings
300
In all, how many students voted for this survey?

15
300
What is the most popular and least popular school supplies?
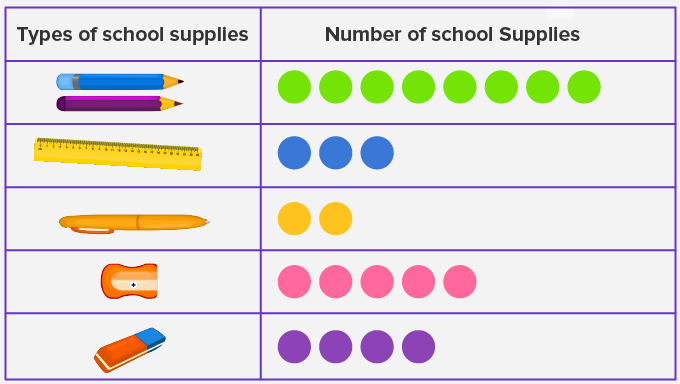
Most = pencis
Least = pens
300
Write the equation with a ? as the unknown.
There are 20 strawberries all together in the bag. Each bundle has 5 strawberries each. How many bundles of strawberries are there?
? x 5 = 20
300
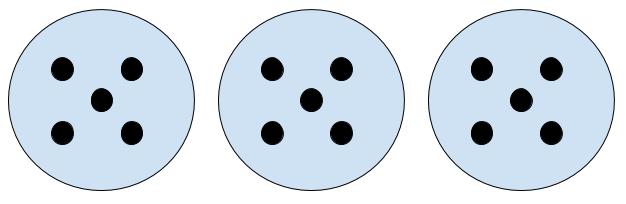
Write the equation and solve it.
There are 5 cars of kids going to the park. Each car can hold 5 kids. How many kids will be at the park?
5 X 5 = 25
300
Give two expressions to represent this array

4 x 8
8 X 4
400
How many more people likes apples than bananas?

25 more
400
How many total apples were sold?

95 apples
400
Give a multiplication expression and product
3 X 5 = 15
400
Give the correct equation with a ? as the unknown
There are some cars in the parking lots. Each parking lot can hold 5 cars and there are 10 parking lots. How many cars are there?
10 x 5 = ?
400
Write the expression and product to match the array

3 X 5 = 15
500
What is the difference between a bar graph and a scaled bar graph?
Regular bar graphs go up by values of 1 and scaled bar graphs go up by values higher than 1
500
What is the difference between a scaled picture graph and a regular picture graph?
Regular pic graph, each picture has a value of one, a scaled picture graph, each picture has a value greater than one
500
Draw a diagram to represent the story. Give the equation also.
There are 5 candy bags, each bag has 4 treats in it. How many treats in all.
I should see a diagram that shows 5 groups with 4 objects in each.
5 X 4 = 20
500
Draw a tape diagram to show
3 x 5 = 15
I will show
500
Draw an array to match the situation.
I have 4 classrooms going on the field trip. Each classroom is bringing 10 students.
XXXXXXXXXX
XXXXXXXXXX
XXXXXXXXXX
XXXXXXXXXX