Mean, Median, Mode, & Range
Box and Whisker
Dot Plot
Population and Sample
Mix it Up!
100
The Average
What is Mean?
100
Lowest value
What is Minimum Value?
100
Each point is represented as a ________________.
What is a Dot?
100
The whole group
What is Population?
100

State the mode
What is 2?
200
The Most
What is Mode
200
Median of Lowest Value and Median
What is Lower Quartile or First Quartile?
200
Data is recorded on a ______________ ______________.
What is a Number Line?
200
A part or portion of the whole group
What is a Sample?
200
A number that does not belong
What is an Outlier?
300
The Middle
What is Median?
300
The difference between Q1 & Q2
What is Interquartile Range?
300
A dot plot shows the _______________ of data
What is Distribution?
300
When a skewed survey question is asked
What is Biased or Bias?
300
Skew
What is Left?
400
The difference between high and low
What is Range?
400
What is the interquartile range?
What is 16?
400
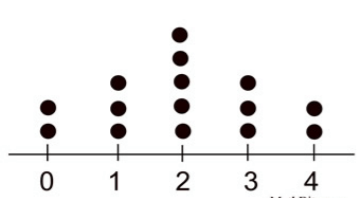 Name the distribution
What is a Bell Curve?
400
A random survey of 500 people in a school about their favorite subject.
What is unbiased or not biased?
400
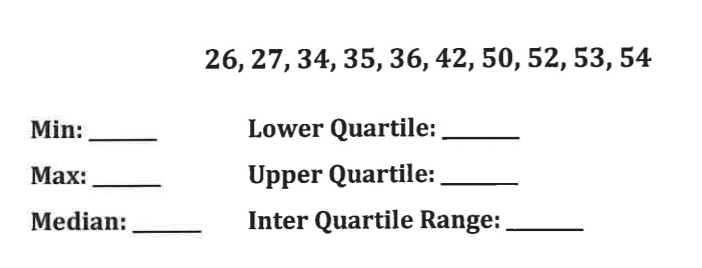
5 Number Summary
What is Min: 26, Max: 54, Median: 39, Lower: 34.5, Upper: 51 & Inter Quartile: 16.5?
500
Find the Median:
5, 9, 3, 4, 4, 4, 6, 7, 0, 9
What is 4.5?
500

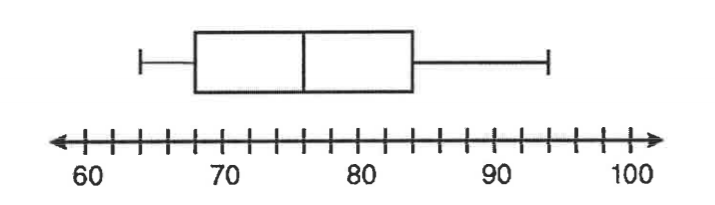
Find the Minimum, Maximum, and Median
What is 64, 94, and 76?
500
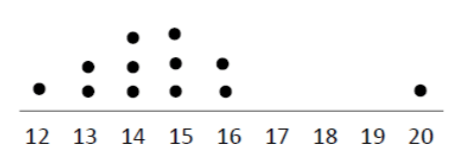
 Name the outlier
What is None?
500
Do you want to waste taxpayer money on a silly bridge?
What is Biased?
500
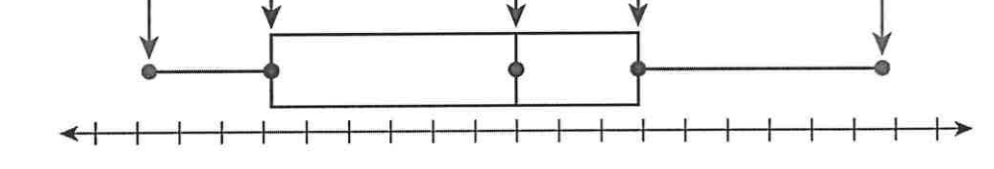
Name the parts of the above image from left to right
What is Minimum Value, Lower/First Quartile, Median, Upper/Third Quartile, & Maximum Value?