Making Inferences
Central Tendencies
Data Variability
Sampling Methods
Data plots
100
This is another word for the word "Inference." Normally this is what you do before you begin an experiment.
What is predict?
100
This would be considered the middle point of the data.
What is the median?
100
This would be the maximum minus the minimum amount in a data set.
What is the Range?
100
This type of sampling method would be considered bias because how easy it was to collect the data.
What is convenience sampling?
100
This type of plot requires a 5 point summary for it to be created.
What is a box plot?
200
In a sample of 500 apples, 27 of them were not able to be eaten. If there were a population of 2,200 apples, then this would be the amount we could predict would not be able to be eaten.
What is 119 apples? (118 would work too)
200
This is the data point that is most impacted by an outlier.
What is the mean?
200
This would be the upper quartile minus the lower quartile in a data set.
What is the Inter-quartile Range? (IQR)
200
This is the type of sampling that would describe this situation: "Mr. Kinsey stood at the door of Scoggins Middle school to ask every third person a question regarding school cleanliness."
What is Systematic Sampling?
200
This would be the range of the following box plot.
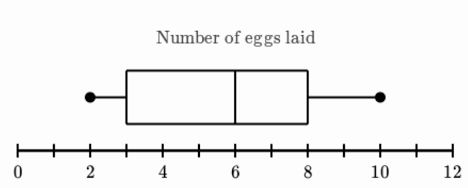
What is 8?
300
In a sample of 50 students, 7 of them did not enjoy the game of football. In the entire population, there were 112 students that did not enjoy the game of football. This would be the total number of students in the population.
What is 800 people?
300
This would be the mean, median, and mode of this set of data:
4, 8, 7, 12, 4, 15, 4
What is 9 (Mean), 7 (Median), and 4 (Mode)?
300
This Store's data should would be considered more variable than the other.
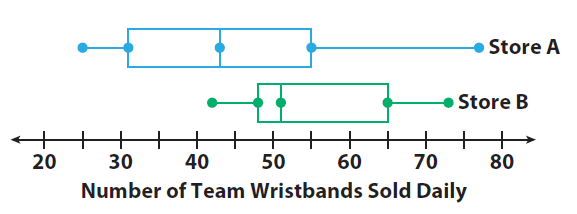
What is store A?
300
This is the part of a population that would be asked a survey question.
What is the sample?
300
This would be the median of the following Dot Plot.

What is 5?
400
This is the amount of people that would prefer pizza with soda out of a population of 1,750 people.
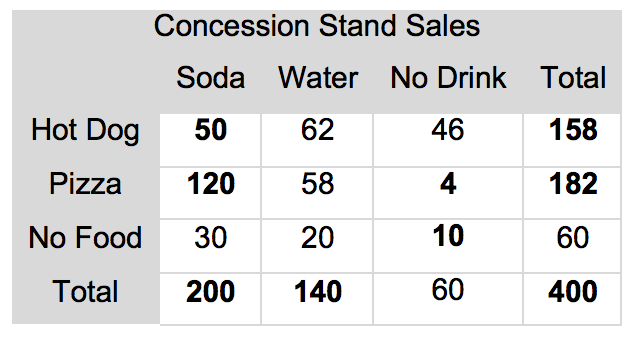
What is 525 people?
400
This would be the best central tendency to determine the most common number in the data set below:
1 , 12, 1, 15, 18, 20, 19, 23, 13
What is the Median?
400
This would be the Box plot with the greater IQR variability.
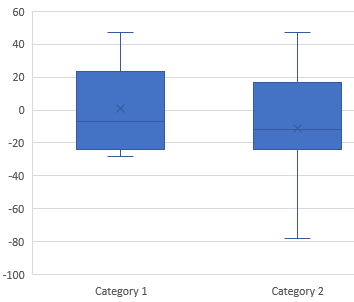
What is Category 1?
400
This sampling method must have 25-40% of the population to participate in its survey to be a valid representation of the population.
What is a simple random sample?
400
This class would be the class with the better median score.
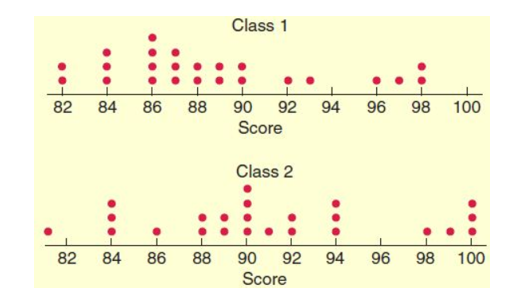
What is Class 2?