Types of Energy
Particle Diagrams
Quantifying Energy
Misc
100
This happens to the kinetic energy of particles in a liquid while it freezes.
What is stays the same?
100
This is shown by adding more wiggly lines (NOT wooshie lines) to a particle diagram.
What is a solid at a higher temperature/KE?
100
This is the q=mc Delta T equation rearranged to solve for specific heat capactiy
What is c = q/(mDeltaT) ?
100
These are the two terms scientists use for a process that is losing energy, like cooling.
What is negative heating AND exothermic?
200
This is true for two different substances that had the same change in temperature.
What is the same change in particle kinetic energy?
200
The physical change shown in this particle diagram
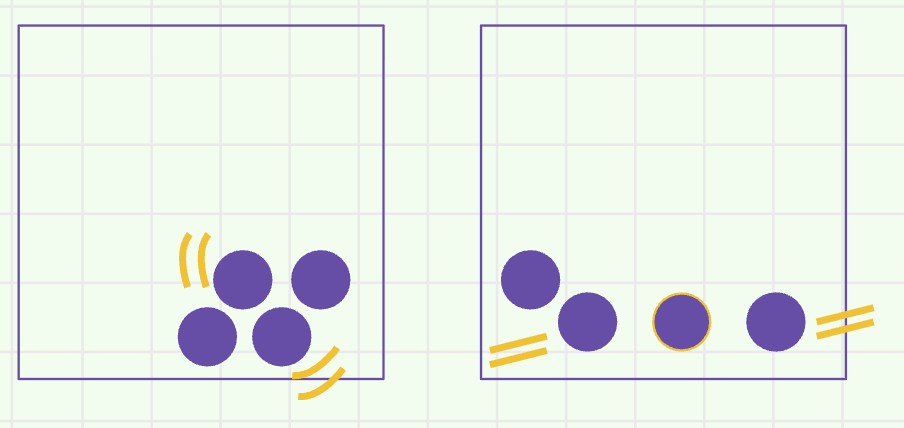
What is melting?
200
50.0 g of water losing 650 J leads to this ΔT. (c = 4.184 J/g°C)
What is -3.1 oC?
200
Hot leftovers are placed in the fridge, and this experiences an energy change of +8368 J.
What is the fridge?
OR
What is the air in the fridge?
300
The type(s) of energy that change going from D to F
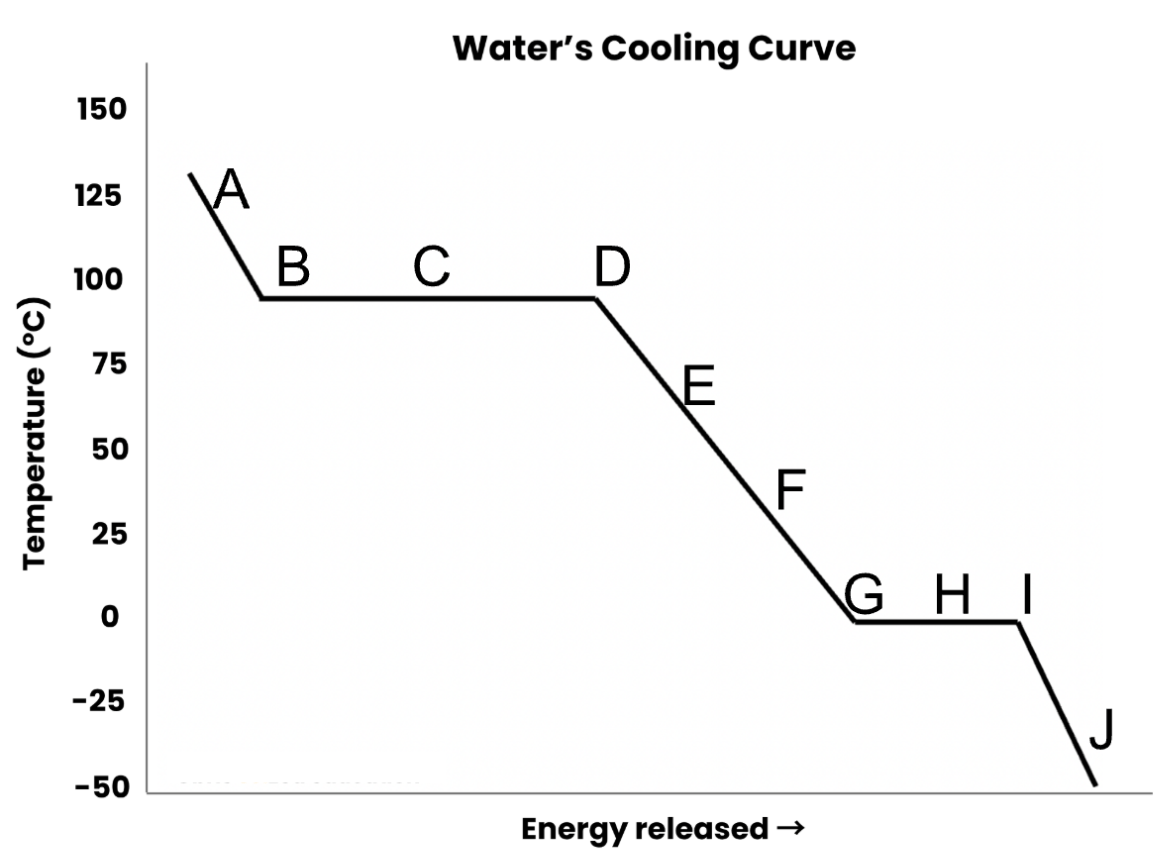
What are kinetic and potential energy?
300
The energy change shown with this particle diagram

What is a change in potential energy?
300
In comparing aluminum (c = 0.90) and plastic (c = 1.7) that each lose 300 J, this substance should show the larger change in kinetic energy.
What is aluminum?
300
This property of matter helps explain why separating particles requires energy
What is electric charge?
OR
What is attraction?
400
This is the phase with the greatest potential energy
What is a gas?
400
A particle diagram to represent the same process as this energy bar chart
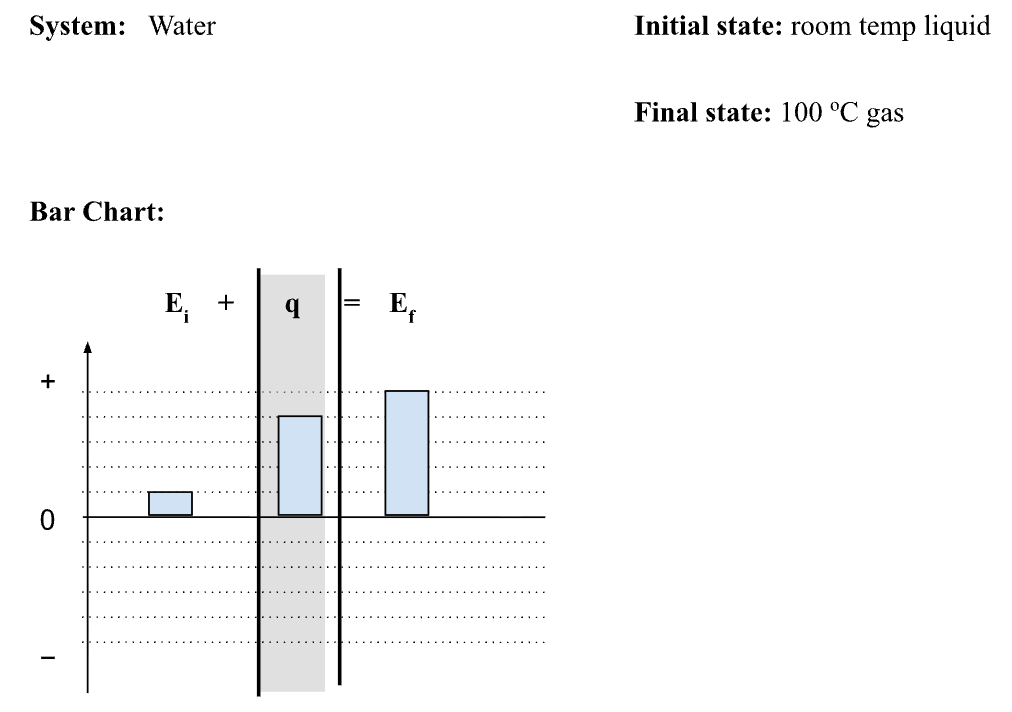
What is a diagram that shows loose liquid particles initially and then spread out gas particles with more wooshies at the end.
400
This is the TOTAL energy change for a 2 g ice cube is placed on a hot plate and heated until it is 60 oC. Melting 2 g of ice requires 668 J. c = 4.184 J/g°C.
What is 1,170 J?
400
The bar chart for water (c=4.184 J/goC) experiencing the same +400 J energy change as the oil (c=2.03 J/goC)shown below.
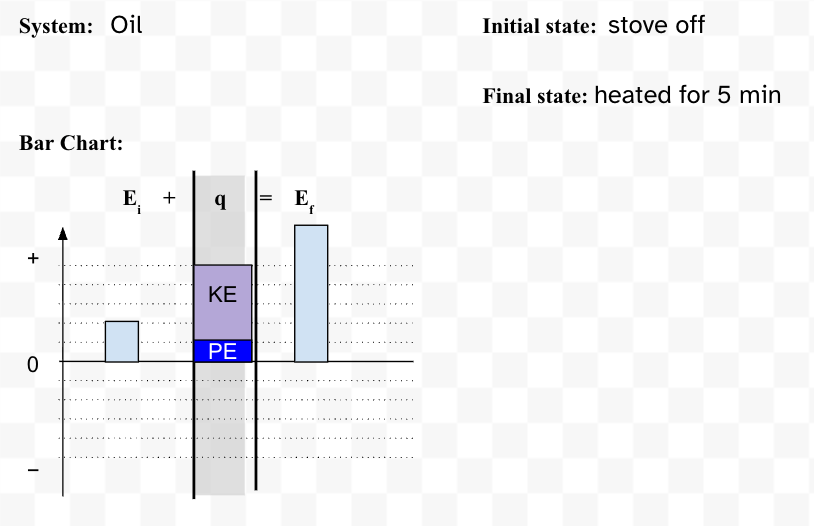
What is a bar chart with the same total energy change but a smaller portion in KE and a larger portion in PE?