Data Types
histoframs and bar charts
Probability of ginger hate from Seth
Seth Data Distributions
Frequency dif
100
What is qualitative data?
Not numbers. Characteristics and descriptive qualities
100
Do histograms use univariate data or bivariate data?
What is univariate data
100
What is the chance of getting a 20 on a d20?
1/20
100
Seth thumb

What is this data chart called?
Skewed left
100
When you add the new frequency to all of the other ones.
What is cumulative frequency?
200
Data that uses one variable
What is univariate data?
200
Pancakkke or wiffles
BOTH
200
What will happen if Seth starts hating gingers again?
1. Hate from class
2. Mr. Lang the sigma gives write up
3. Seth becomes depressed
200
Is this a histogram or a bar chart?

Histogram
300
Data that uses numbers
What is quantitative data?
300
Make a tree diagram for flipping coins.
(I will look at the histograms and grade)
300
Make a skewed left chart.
(grade from me)
300
What data distribution is this?
Approx. Symetrical
300
Percentage frequency
What is relative frequency =>
400
Give me an example of a histogram
I grade
400
What is the chance of getting heads 3 times in a row on a coin?
1/2 x 1/2 x 1/2= 1/8th
400
Seth's other thumb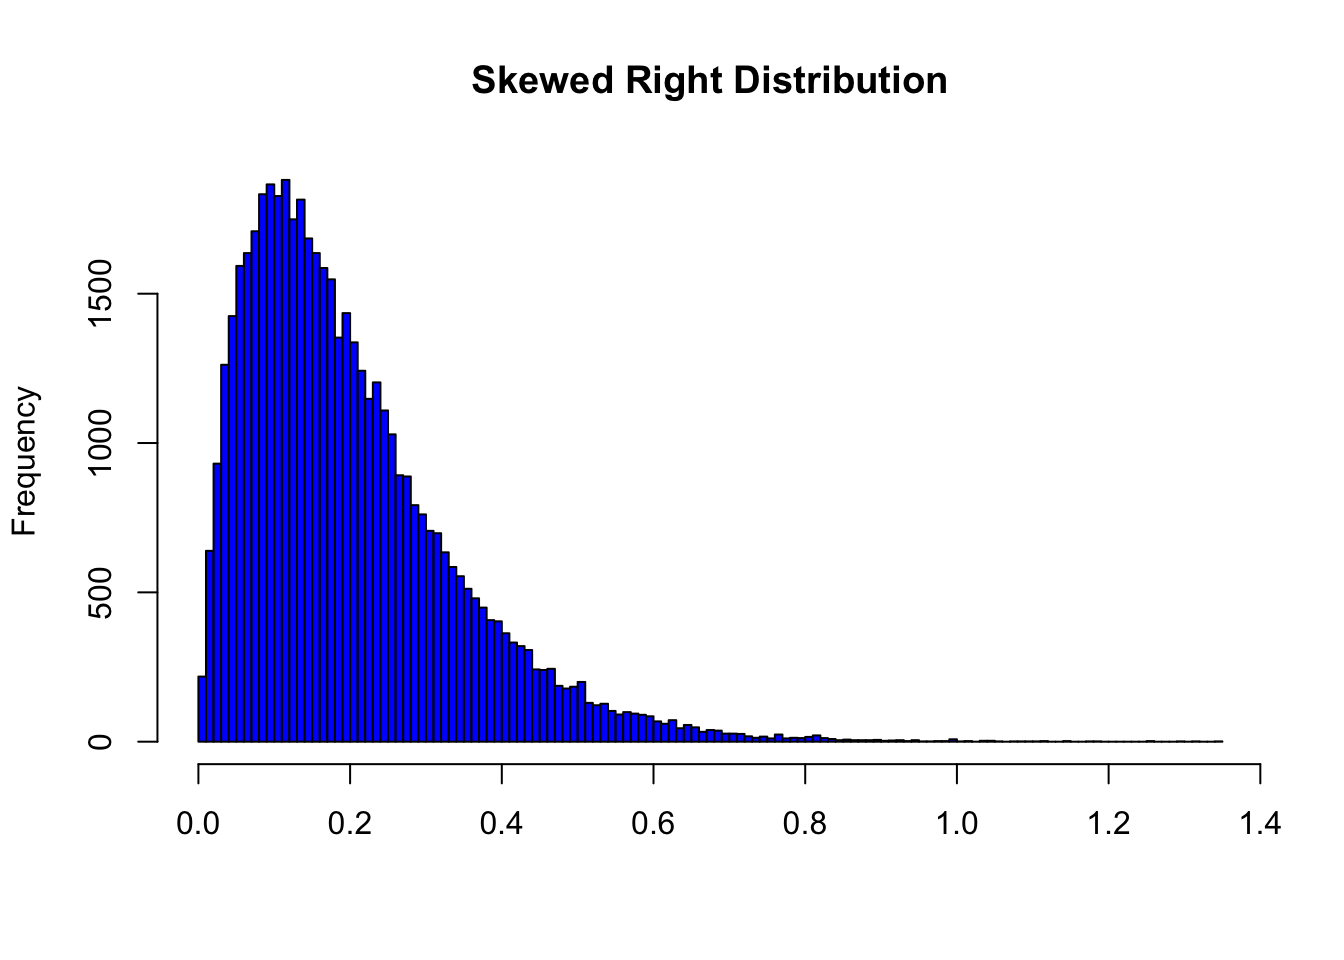 What is this chart's name?
Skewed Right
500
What is a histogram?
(GOOGLE ANSWER HINT)
A histogram is a chart that plots the distribution of a numeric variable's values as a series of bars. Each bar typically covers a range of numeric values called a bin or class; a bar's height indicates the frequency of data points with a value within the corresponding bin.
500
Find the outlier.
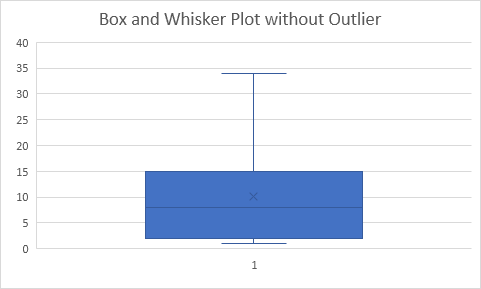
At the 34.5