Dot Plot 1
Dot Plot 2
100
A teacher asked 20 students how many books they read last summer. The dot plot displays the data.
What number of books did most students read?

1
100
The following dot plot shows the number of hours 15 people exercised per week.
Each dot represents _____.
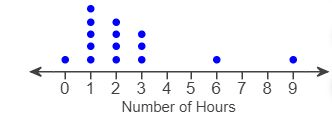
one person
200
A teacher asked 20 students how many books they read last summer. The dot plot displays the data.
How many students read more than 5 books?
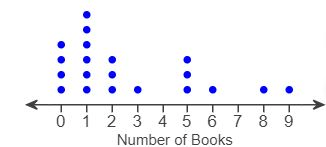
3
200
The following dot plot shows the number of hours 15 people exercised per week.
What is the greatest number of hours exercised?
9
300
A teacher asked 20 students how many books they read last summer. The dot plot displays the data.
How many students read less than 4 books?

14
300
The following dot plot shows the number of hours 15 people exercised per week.
Most people exercised _______ hours.

1
400
A teacher asked 20 students how many books they read last summer. The dot plot displays the data.
How many students read more than one book but less than five?

4
400
Most people spent between _ and _ hours at the gym.
0 and 3
500
A teacher asked 20 students how many books they read last summer. The dot plot displays the data.
What conclusions can you make based on the graph?
Most students read between 0 and 3 books.
Two students really like to read.
Four students probably dislike reading.
500
How many people exercised less than 3 hours?
10