Graphing 101
Kinematics 1
Kinematics 2
Kinematics 3
Visual Representations
100
- What type of motion is this?
- Which way is the object going?
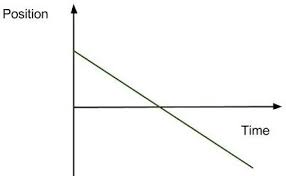
- Constant Motion
- Negative or Left
100
Final Position = 88 m
Initial Position = 0 m
Velocity =
Time = 15 s
v = 5.87 m/s
100
Final Velocity = 100,000 m/s
Initial Velocity = -100 m/s
Acceleration = ?
Time = 20 s
a = 5,005 m/s^2
100
Displacement = 1600 m
Initial Velocity = 5 m/s
Acceleration = ?
Time = 21 s
a = 6.78 m/s^2
100
I am a simple diagram that represents motions with dots and numbers. What am I?
Dot Diagram
200
- What kinda of motion is this?
- What does the slope of this graph represent?
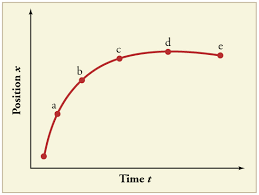
- slowing down
- Velocity
200
A car starts at 0 m and moves at v=5 m/s for 3 s.
Find the final position?
15 m
200
A car starts from rest and accelerates at 2.5 m/s^2 for 4 s, what is the final velocity?
Final Velocity = 10 m/s
200
A car starts from rest and accelerates uniformly at 3 m/s^2 for 5 s. How far does it travel?
37.5 m
200
The length of the arrows on a motion diagram represents what?
The dots on a motion diagram represent what?
- the speed
- the location of the object
300
- What type of motion is this?
- What does the slope of the graph represent?

- Constant motion
- Acceleration
300
A train starts at −20 m and moves at 12 m/s for 15 s.
Find the final position?
160 m
300
A skateboarder increases speed from 3 m/s to 9 m/s in 3 s
- What is the acceleration?
- a = 2 m/s^2
300
A runner starts at 4 m/s and accelerates at 2 m/s^2 for 6 s. What is the total displacement?
96 m
300
What does magnitude mean?
- the numerical value associated with the physical quantity you are solving for.
400
- What kind of motion is this?
- Slowing down
400
A balloon is traveling up at a speed of 7 m/s. If a 3.4 m tall person where to let it go where would the balloon be after 11 s?
xf = 3.4 + 7(11)
80.4 m
400
A sprinter accelerates from 5 m/s to 20 m/s at a constant rate of 3 m/s^2
How long does it take to reach 20 m/s?
- t = 5 s
400
A motorbike moves from rest with an acceleration of 1.5 m/s^2. How long does it take to cover 45 m?
7.75 s
400
Which of these graphs are speeding up?
a.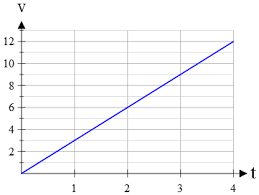 b.
b.
c. 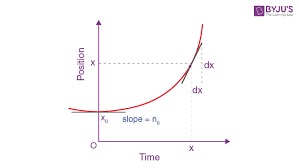 d.
d.
A and C
500
-Which part of the graph is going the furthest distance?
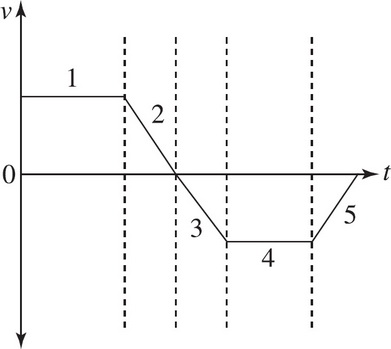
- both 1 and 4 are tied. Same area "under the curve"
500
A ship is at 50 km and sails at 30 m/s for 2 hours.
Find the final position.
convert 50 km to m (50,000)
convert 2 hrs to seconds (7,200)
50,000 + 30 (7,200) = 266,000 m
500
A car moving at 25 m/s applies the brakes and slows down uniformly at −2.5 m/s^2.
- How long does it take to come to a complete stop?
- Then, find the velocity after 3 s braking.
- 10 s to stop
- 17.5 m/s after 3 s
500
If A car starts at position 17 m as it travels at 20 m/s applies the brakes and slows down uniformly at -4 m/s^2. What would it be the final position when it comes to a stop?
67 m
500
Name as many visual representations as you can, the person with the most gets all the points.
- Sketch - Dot Diagram - Motion Diagram
- Position vs Time Graph - Velocity vs Time Graph
- Acceleration vs Time Graph