Name that Data Display
Measures of Central Tendencies
Histograms
Two-Way Table Relative Frequency
Box & Whisker Plots
100
A data display in which each data value is displayed using a dot or x.
What is a Dot Plot or Line Plot
100
Name of the data value which occurs the most often.
What is the mode.
100
How many lottery winners were between 50-59 years old?

8
100
What percentage of students have no curfew?
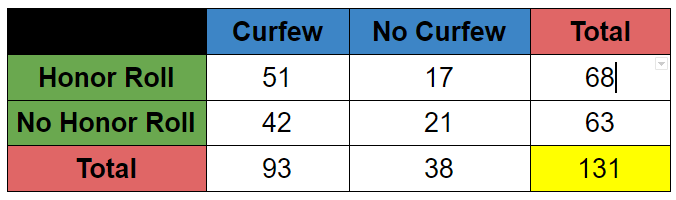
38/131
29%
100
What was the median score on the test?
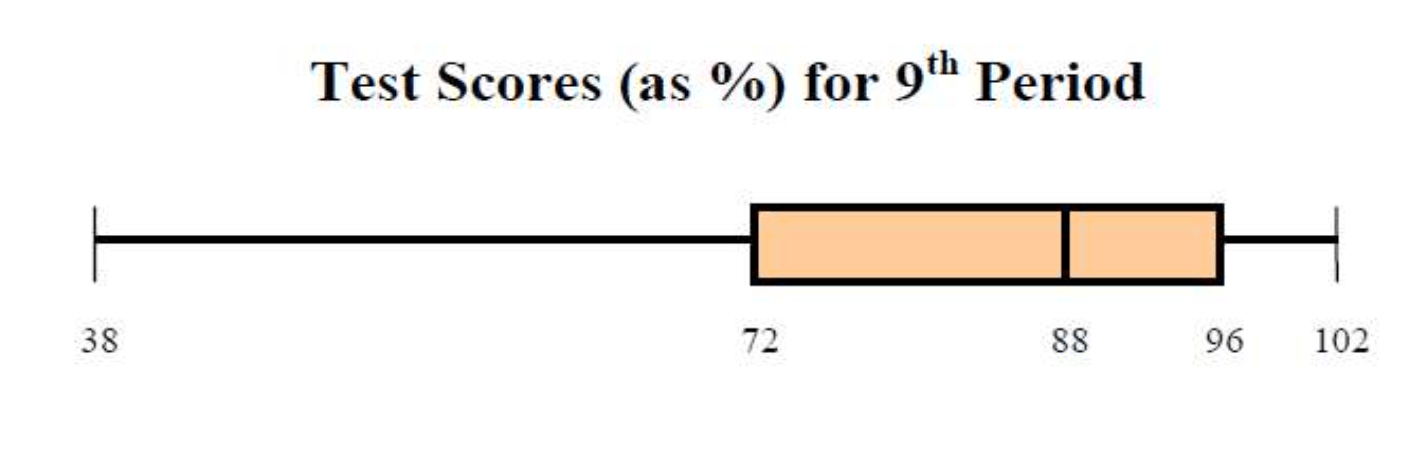
88%
200
A graph that displays the relationship between two data items and is used to determine if there is a relationship between these data items.
What is a scatter plot.
200
Name for the difference between the largest data value and smallest data value.
What is the range.
200
How many lottery winners were at least 60 years old?
9
200
What percent of students who are on the Honor Roll have a curfew?

51/68
75%
200
What is the percentage of students scored above 88% or above?

50%
300
When a scatter plot indicates there is a linear relationship this line is drawn and used to predict other data points.
What is a line of best fit / trend line.
300
This measure of central tendency is found buy dividing the sum of all the data values by the number of data items.
What is mean / average.
300
The histogram below represents peoples test scores. How many people took the test?

18
300
What percent of students who have a curfew and are not on the honor roll?
42/93
45%
300
True or False:
Given a box & whisker plot you know all of the data values in the data set?
False
A box & whisker plot show a distribution of the data represented in quartiles.
400
This data display is used to show the distribution of data with in equal intervals.
What is a histogram.
400
Name for the data item which is in the middle of the data; this value may or may not be one of the actual data values.
What is the median.
400
How many lottery winners were 39 years old or younger?
7
400
What percent of students who don't have a curfew and are on the honor roll?
17/38
44.7% or 45%
400
What are all the possible score for students in the inter-quartile?
72 to 96
500
This data displayed shows the distribution in equal quartiles.
What is a box & whisker plot / box plot.
500
How do you find the median of a data set?
1. list the value in ascending order
2. if there is an odd number of data items find the middle number; that is the median
3. if there is an even number of data items find the average of the two numbers; this is the median.
500
What is the most common age group?
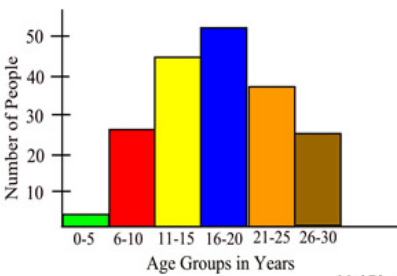
16-20
500
What percent of students are not on the honor roll?
63/131
48%
500
Mary scored in the upper quartile. She did not have the highest score. What is a possible score Maru could have had?
anything above 96 and lower than 102.