R Code
Chapter 2
Chapter 3
Chapter 4
Chapter 5
100
The code to produce the first six rows of a data set
head(data_set)?
100
What are the two types of measurements? Give an example of each
Quantitative and Categorical. Quantitative: Values that represent some quantity. Categorical: Characteristics or qualities of a subject that can be grouped into distinct categories.
100
What's the difference between population and sampling variation?
Population variation is the variability in the population. Sampling variation comes from the sampling process.
100
The explanatory variable is also known as the ______. The outcome variable is also known as the ________.
Explanatory: Independent variable --> Factor that is being manipulated
Outcome: Dependent variable --> Factory that is measured and expected to change in response to the independent variable
100
What is residual?
Differences above and below the model of the distribution --> mean, median, mode, etc
200
What does the code favstats() do?
Min, Q1, median, Q3, Max. As well as mean, sd, and n
200
What is independent sampling? Give an example
The selection of one object for a study has not effect on the selection of another object. If two are selected, they are selected independently
200
The shapes of distributions are classified as either ________, _________, or _________
Left-skewed, right-skewed, or symmetrical (normal) 

200
What's the difference between within-groups and between-groups?
Within groups: Variation among members of the same group
Between groups: Variation among members of different groups
200
Data = Model + error. What does each mean?
Data is the data point
Model = the number we are using to represent the whole distribution. Can be mean, mode, or median. Usually mean
Error = The data's point deviation from the model (the error)
300
If you'd like to see an overview of what's in the data frame - a list of your variables, whether they're numeric or factors, and so forth -- what command would you use?
str()

300
Characteristics of a population are called ________. Characteristics of a sample are called _______
What are population and sample? Give an example of each
Population: parameters. Entire group of individuals that are the interest of a study. Sample: statistics. Subset of the population.
300
What's the equation for IQR and to find a small and larger outlier? ?
IQR: Q3-Q1
Bigger: Q3 + 1.5 * IQR
Smaller: Q1 - 1.5 * IQR
300
What does thumb length = height + other stuff mean?
Thumb length is the outcome variable, height is the explanatory variable.
Variation in thumb length is explained by variation in height plus variation in other stuff.
300
The mean for the class's thumb length is 63 inches. A student in the class has a thumb lenght of 61.4 inches. What is their error? What is the code to find the residuals?
Data = Mean + error
Error = data - mean
Error = 61.4 - 63 = -1.6. Meaning the student's thumb length is below the mean.
Code: resid()
400
 What is the correct answer and explain what one of the wrong answers does
Correct answer: B
A) Arrange will sort the data
C) Includes everything except exactly 200
D) Tally() will count the values (frequency of count)
400
What is sampling variation? What's the code to get the samples?
Every sample we take will vary. Code for this sample()
400

What are bins? And what is it set to ?
Bins are the interval or space between the bars. For this one it's set to 4.
400
Whats the difference between a density and frequency? Why is it useful?
Frequency represents the count so how many are in a certain group. Density shows the proportion of cases, and it's useful to show comparisons of different groups that have different counts.
400


What’s the difference between these two equations?
The first equation discusses parameters, while the second one discusses statistics.
500
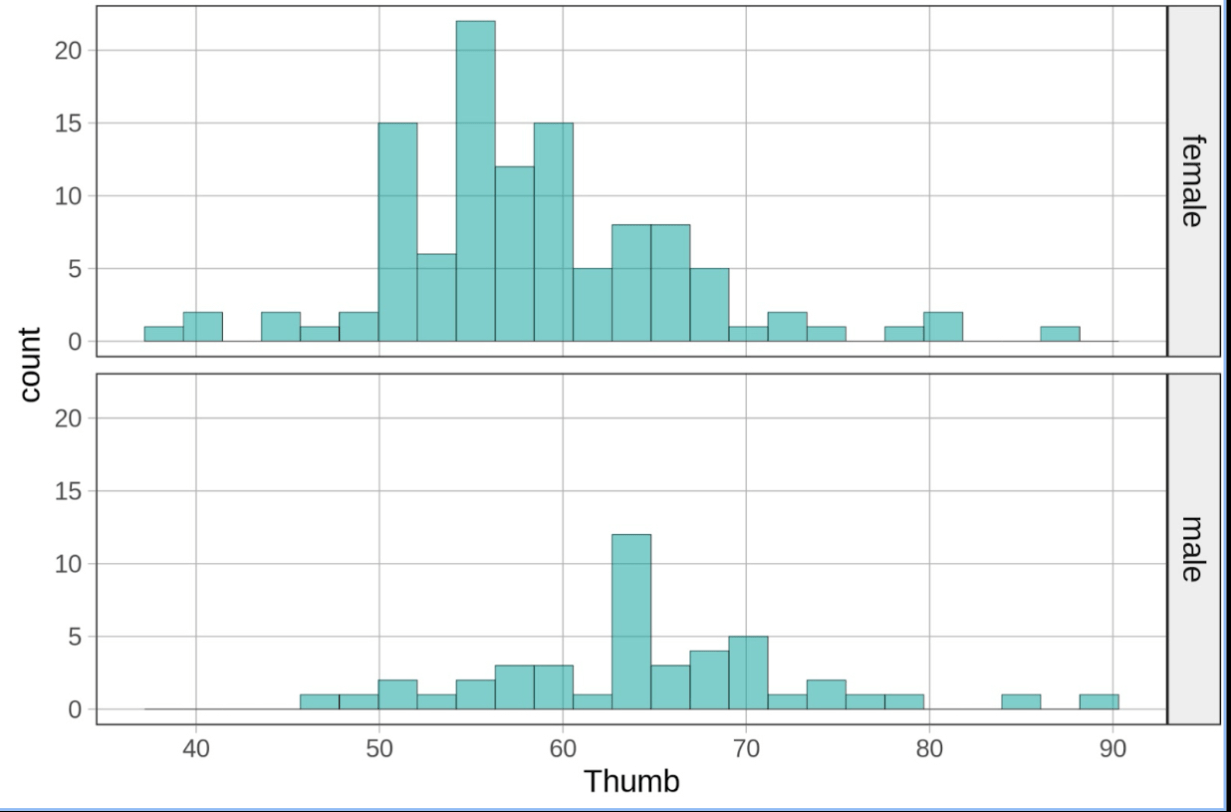 The code for this?
gf_histogram (~y, data = data_set) %>% gf_facet_grid(X~ .)
500

Many different responses. But case is row, variable is column, and value would be that number in the row and column. So example Annie, AvgMercury, 1.33
500

What’s the 5 number summary ? And how much data is represented from one number to the other?
Min: Around 19
Q1: Around 29
Median: around 38
Q3: Around 45
Max: Around 65
From one number to the other its 25% of the data. EX: From Min to Q1 is 25% of the data
500
A researcher wants to know whether the type of study environment affects students test scores using either silence, background music, or noisy cafe. After a week of studying all the students take a test out of 100. What visualization type would you use?
What is faceted histogram, box plot, jitter plot, scatter plot
500

What’s the difference between the two graphs? What’s the code to get the blue line? What does the blue line represent?
The first graph takes the thumb length of everyone regardless of gender while the second graph divides the data set into the categorical variable gender. The blue line represents the mean of the data set and its produced by gf_hline(). Can see the mean aka blue line on a coefficient (lm()) 