Q & A
What Do You Mean?
Whole Numbers
Fraction Fun
100
Use the following line plot to answer the question:
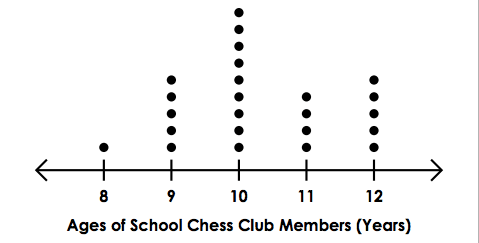
What is the most common age?
10 years old
100
Highest value - lowest value
Range
100
Use the following line plot to answer the question:
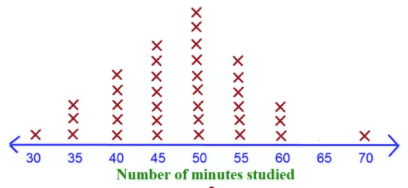
What was the LEAST common number of minutes studied?
30 and 70 minutes.
100
Use the following line plot to answer the question:
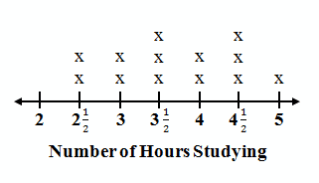
What is the median number of hours spent studying?
3 1/2 hours
200
Use the following line plot to answer the question:

What is the range of ages in the chess club?
4 years
200
Value that occurs the most frequently
Mode
200
Use the following line plot to answer the question:
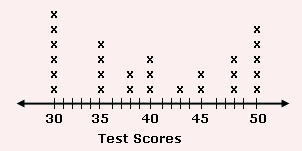
What is the difference between the highest and the lowest test scores?
50 - 30 = 20
200
Use the following line plot to answer the question:

John tracked the number of hours he studied for each of his study sessions leading up to his final. How many times did he have a study session?
13 study sessions
300
Use the following line plot to answer the question:
How many members are eleven or twelve years old?
9 students
300
Half of the data falls below and half of the data lies above this point
Median
300
Use the following line plot to answer the question:
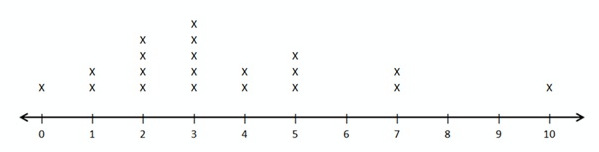 Is there an outlier in this line plot? If so, what is the outlier?
Yes, 10
300
Use the following line plot to answer the question:
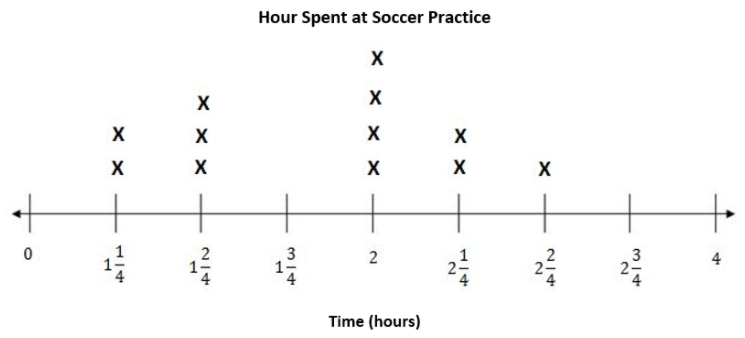
What was the most common time spent at soccer practice?
2 hours
400
Use the following line plot to answer the question:
How many Chess Club Members are younger than 11 years old?
15 Chess Club Members
400
Sum of values divided by number of data points
Mean (aka average)
400
Use the following line plot to answer the question:
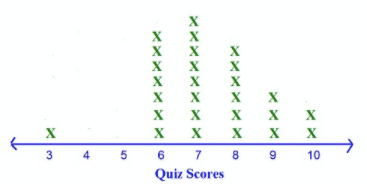
How many people scored higher than 7 on the quiz?
11
400
Use the following line plot to answer the question:
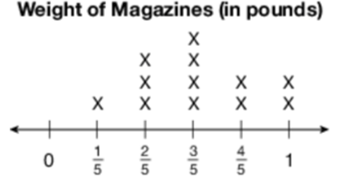
What is the difference between the heaviest and the lightest magazines?
4/5 pounds
500
Use the following line plot to answer the question:
How many total members are in the Chess Club?
24 Members
500
Chart used to organize and tally data in a set before creating a line plot
Frequency table
500
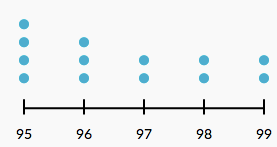
Make a line plot using the following data set:
99, 97, 95, 96, 95, 95, 96, 95, 99, 98, 98, 97, 96
500
Use the following line plot to answer the question:
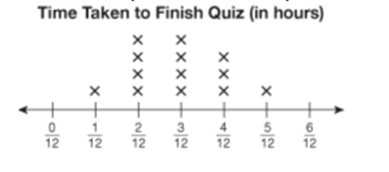
What was the mean time it took students to finish the quiz?
38 / 12 divided by 13
38 / 12 x 1/13 = 38 / 156 = 19/78 = 0.24 hours