Interpreting Data
Creating a Line Plot
Random
Adding and Subtracting with a Line Plot
Review
100
BONUS: What is Ms. Onken's favorite number?
13
100
Use the data to create a line plot.
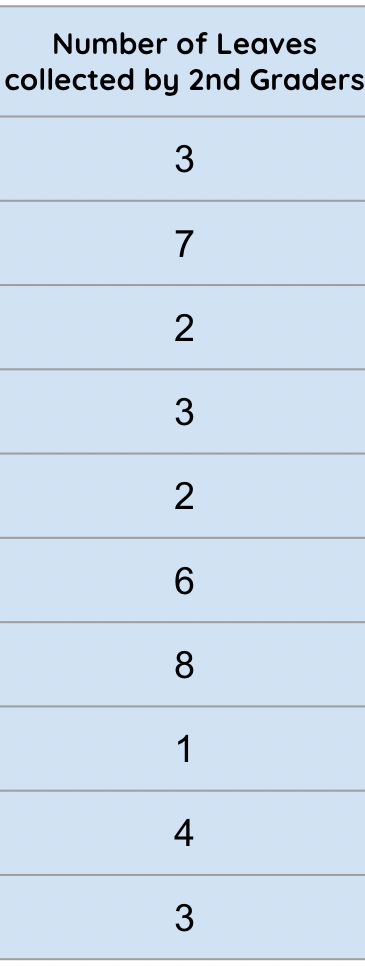
Student drawn line plots
100
What is the title of a line plot and why is it important?
The title is the name of the line plot usually found above the plot. It tells you what the data is about.
100
How many student towers measured 8, 9, and 10 inches?

4 + 1 + 2 = 7
100
2/3 x 5/6
10/18 or 5/9
200
Take a look at the line plot. What are 2 mathematical 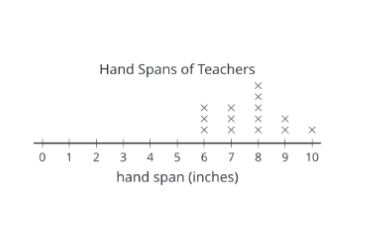 statements you can make about it?
Varied Student responses
200
BONUS: Name the marathon Ms. Onken ran in November
Philadelphia Marathon
200
3 divided by 1/5
15
200
How many more students had 12 inch towers than 20 inch towers?
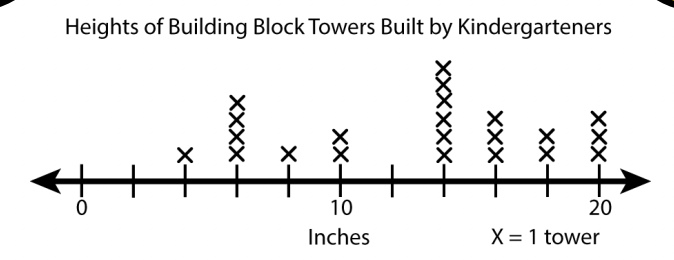
6 students had 12 inch towers.
3 students had 20 inch towers.
6-3= 3
3 more students had 12 inch towers than 20 inch towers.
200
BONUS: How many siblings does Ms. Onken have?
2 - one older and one younger
300
Look at the following line plot. How many group members had pencils measuring 13 and 14 centimeters?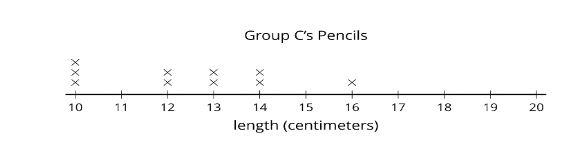
2 measured 13cm.
2 measured 14cm.
Altogether, 4 pencils measured 13 or 14 centimeters.
300
What is missing in this line plot?

The title and the label of what the numbers are.
**ALWAYS LABEL AND TITLE YOUR LINE PLOTS**
300
1/12 divided by 2
1/24
300
How many classrooms were at 50 or less?

15
300
The word "of" in word problems means to do what mathematical function?
Multilpy!
400
Look at the following line plot. How many students saw less than 10 butterflies?

10 students
400
Show the following data on a line plot.

Student drawn line plots.
400
6 2/3 x 3 3/5
24
400
How many carpets are in this survey?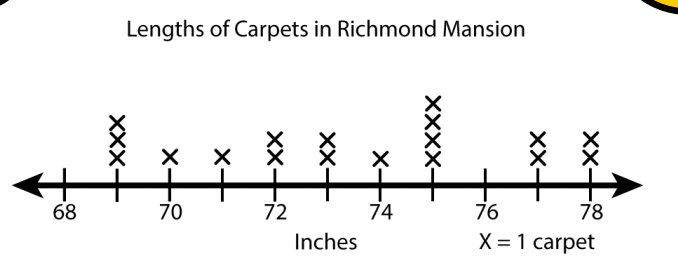
18
400
2 1/3 x 4 1/5
9 4/5
500
Look at the following line plot. How many children are on the line plot?
6 + 5 + 3 + 4 + 2= 20
500
Create a line plot with the following data:
Height of second grade students in Mrs. Largin's class:
48 in. 46 in.
42 in 48 in.
43 in. 42 in.
49 in. 41 in.
Student drawn line plots.
500
Order these from least to greatest:
3 1/5, 3 1/5 x 9/10, 3 1/5 x 1 1/2
3 1/5 x 9/10, 3 1/5, 3 1/5 x 1 1/2
500
BONUS: What day and month is Ms. Onken's birthday?
March 13th
500
3 3/5 x 2 5/7
9 27/35