Residuals
Linear Equation
R Squared
Association
Correlation
100
Your data provides a predicted value of 58.74 and an observed value of 98.12. Does your model overestimate or underestimate the value at this point? Why?
Underestimate - the predicted value is below the observed.
100
What is the equation for linear regression?
y=mx+b
f(x)=ax+b
100
What does r2 tell us?
Measures how well the graph of the regression fits the data
100
Indicate what association you expect for the pair of variables: positive, negative or none:
a person’s blood alcohol level; time it takes the person to solve a maze
Positive
100
Describe what correlation coefficient tells us
Indicates the type (positive or negative) and strength of the relationship that may exist for a given set of data points.
200
With an observed value of 25.8 and a predicted value of 45.9, what is the residual?
-20.1
200
Predicted Price = 18.617 + 103.929x (x = Capacity). This is the regression equation for disk space Capacity (in megabytes) versus Price at a local store. With a capacity of 2 mb, what would you expect the price to be?
$226.475
200
The correlation between a cereal's fiber and potassium is r=0.903. What is the percentage of accuracy of our linear regression equation?
0.8154
OR
82%
200
Indicate what association you expect for the pair of variables: positive, negative or none:
the price charged for fund-raising candy bars; number of candy bars sold
Negative
200
Describe a correlation of -0.9 in terms of strength (weak, moderate, or strong) and direction.
Strong, negative.
300
What does a negative residual indicate - where is the observed value in comparison to the predicted value?
The observed is below the predicted value.
300
When is Mr. Ross's birthday?
Hint: I always eat LUCKY CHARMS the day before.
March 18th!
300
Two variables have a correlation of -0.89. What is the R-squared?
0.7921
Or
79%
300
Indicate what association you expect for the pair of variables: positive, negative or none:
the number of miles a student lives from school; the student’s grade point average
None
300
Which graph has a stronger correlation? (1,2,3)
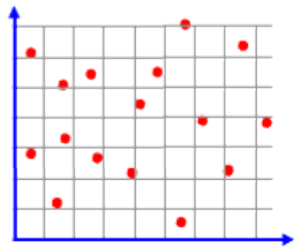
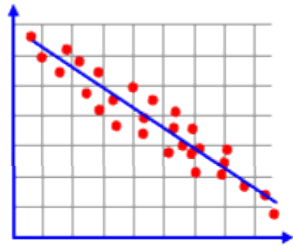
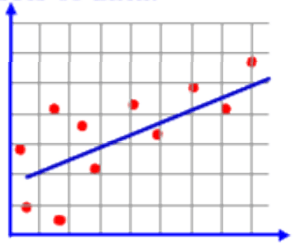
2
400
Given the regression model: Predicted Verbal SAT Score = 171.333 + 0.6943Math SAT Score. Would you rather have a positive or negative residual? Why?
Positive - you always want a higher score than the predicted.
400
The linear model for a local store's Number of Sales people working versus Sales is as follows: Sales = 8,106 + 91.34x (x = Number of Sales People Working). With 14 people working, what would you expect sales to be?
$9,384.76
400
A study showed that students who study more hours tend to do better on statistics exams. In fact, number of hours studied explained 81% of the variation in exam scores among the students who participated in the study. What is the correlation between hours studied and exam score?
r=0.9
400
Indicate what association you expect for the pair of variables: positive, negative or none:
weekly sales of hot chocolate at a Montana diner; the number of auto accidents that week in that town
None (Up for debate)
400
A restaurant's menu items are compared in terms of correlation. Sugar versus Calories have a correlation of 0.25. Sugar versus Protein has a correlation of -0.68. Which has a stronger correlation?
Sugar versus Protein.
500
The linear model for a local store's Number of Sales people working versus Sales is as follows: Sales = 8,106 + 91.34x (x = Number of Sales People Working). If two people are working (your x), the observed value is $8600. What is the residual?
$311.32
500
An analysis of Math SAT versus Verbal SAT scores gives an equation of Predicted Verbal SAT Score = 171.333 + 0.6943x (x = Math SAT Score). What would you predict someone's verbal score to be if they got a 520 on their Math section?
532.369
500
Students with above-average scores on Exam 1 in STAT 001 tend to also get above average scores on Exam 2. But the relationship is only moderately strong. In fact, a linear relationship between Exam 2 scores and Exam 1 scores explains only 36% of the variance of the Exam 2 scores.
(a) The correlation between Exam 1 scores and Exam 2 scores is r = 0.36.
(b) The correlation between Exam 1 scores and Exam 2 scores is r = 0.6.
(c) The correlation between Exam 1 scores and Exam 2 scores is either 0.36 or -0.36 (can't tell which).
(d) The correlation between Exam 1 scores and Exam 2 scores is either 0.6 or -0.6 (can't tell which).
(e) There is not enough information to say what r is.
B
500
As the age of the car increases, its value decreases. Which scatterplot represents this relationship?

C
500
A student says, "There was a very strong correlation of 1.22 between Sugar and Fat content." Explain the mistake made here.
Correlation is between 1 or -1