A new process designed to increase the temperature inside steel girders shows great promise. Using an initial temperature (degree C), we can predict the final temperature (degree C) by using a slope of 1.095. Interpret that value.
For each additional degree in initial temperature there is a 1.095 degree predicted increase in final temperature.
A scatterplot displays the association between the size of a diamond (in carats) and its retail price (in Singapore dollars) for 48 observations. Use the model to predict the cost of a 0.25 carat diamond.
cost-hat=197+ 4,000(size)
1,197 Singapore Dollars
A bivariate set of data relates the amount of annual salary raise and previous performance rating. The least-squares regression equation
y-hat = 1,400 + 2,000x ,
where ^ y is the estimated raise and x is the performance rating. Identify the slope value and y-intercept value.
slope: 2,000
y-int: 1,400
This graph shows the relationship between two quantitative variables.
What is a scatterplot?
What is wrong with the following statement?
The correlation between baseball position and number of hits at bat is .93.
Correlation only measures quantitative variables.
A new process designed to increase the temperature inside steel girders shows great promise. Using an initial temperature (degree C), we can predict the final temperature (degree C). The equation has a y-intercept of 37. Interpret the value.
There's a predicted final temperature of 37 degrees C, when the initial temperature is 0 degrees C.
Using the model:
cost-hat=197+ 4,000(size)
Calculate the residual for a diamond with 0.31 carats and a cost of 1,500 Singapore Dollars
1500-1437= 63
Explain why it isn’t correct to say that the correlation is 0.87 mg/cal.
correlation has no units of measure
The linear relationship between number of dentist visits and number of cavities is #of cavities=-1.3 (# of office visites +6, the coefficient of determination is 74.3%. Correlation is ?
What is -.86
What does r= -.73 tell you about the correlation?
There's a strong, negative linear association between variables
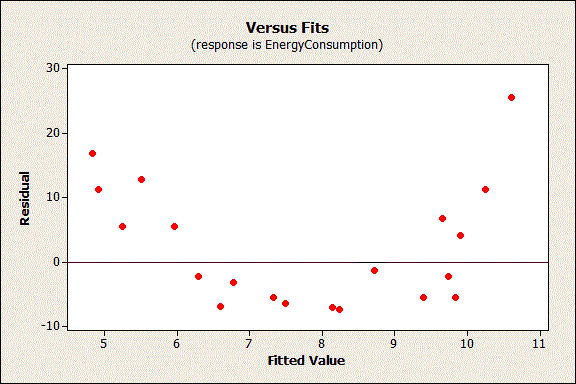
 Use the residual plot to answer whether a linear model is appropriate in this case.
A strong pattern indicates a linear model is NOT appropriate
If the average time to complete a task is 27.7 seconds, with a standard deviation of 9.3 and the average age in years of participants is 34.1 with a standard deviation of 5.4, find the slope for the LSRL that would model using age to predict the time it would take to complete the task. Given r = - 0.83
b1= -0.482
This variable goes on the x-axis and this variable goes on the y-axis.
What is the explanatory on the x-axis and the response on the y-axis?
These are the four feature you describe when describing a distribution.
What is center, shape, spread, and outliers?
98% of the variation in weight gain can be explained by the variation in calories burned. Name this value, and find correlation.
r-squared or coefficient of determination
r= -0.99
What is it called when you make a prediction using your model for an x-value outside your data set?
Extrapolation
What point does EVERY LSRL model go through?
( x-bar, y-bar)
You would look at this plot to check to see whether a linear regression is appropriate.
What is the residual plot?
Using N(1152, 84), the Normal model for weights of Angus steers, this percent of steers weigh over 1250 pounds.
What is 12%?
What does a positive residual indicate?
The linear model has made an under prediction or the actual value is larger than the predicted value.
 The smallest tree has an actual height of 312 cm. Find its predicted value if the actual value has a height of 40 cm below the predicted.
-40=312-p
p=352 cm
The proper name for the line-of-best-fit is the "Least Squares Regression Line"... What goal does this line achieve that gives it its name?
It minimizes the sum of the squared residuals
ie, minimized the sum of the squares from the response variable to the predicted response variable.
The percent of variability in the response variable that is explained by the linear relationship given the explanatory variable.
What is r squared or coefficient of determination?
Given the following 5 number summary, state the shape of the distribution: 1, 10, 15, 16, 17
What is skewed to the left?