Coordinate Plane
Tables
Equations
Graphs
Mystery!
100
What is the ordered pair that represents the origin?
(0,0)
100
The independent variable is always on the _________ side of a vertical table.
left
100
In the equation y = 2x - 8, what are the coordinates of the y-intercept?
(0, -8)
100
The graph shows a linear relationship. Is the relationship proportional or non-proportional? How do you know?
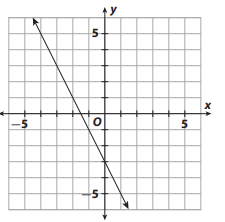
Non-proportional
100
Which of the following situations represents a proportional relationship?
A. Mrs. McCoy asks each student to bring 3 pencils to class.
B. Ms. Black's students spend 5 minutes to complete each problem.
C. Ms. Bansal gains one new student each week. She started with 20 students.
C
200
What quadrant has negative x values and positive y values?
Quadrant II
200
List the dependent quantities.
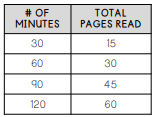
15, 30, 45, 60
200
Which equation represents the table?

A. y = 125x B. y = 50x + 75
C. y = x + 125 D. y = 50x - 75
B y = 50x + 75
200
When looking at a graph, I can determine if the relationship is proportional or non-proportional by ____________________________.
Seeing where the graph crosses the y axis
200
Identify the rate of change and y-intercept from the equation below.
y = 0.25x - 8
Rate of change: _______
Y-intercept: ______
Rate of change: 0.25
Y-intercept: (0, -8)
300
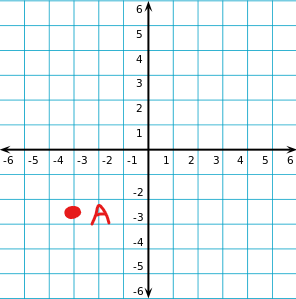
What are the coordinates of point A?
(-3, -2,5)
300
Write an equation to represent the table. 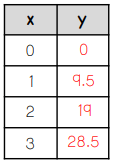
y = 9.5x
300
Sam is making a yard service business. Sam plans to charge $17.50 for each lawn that he mows and $3 for each flower bed that he clears.
Write an equation to represent the scenario.
y = 3x + 17.50
300
What are the coordinates of the y-intercept shown in the graph?
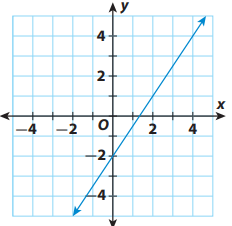
(0,-2)
300
Determine the constant of proportionality.
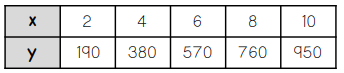
k = 95
400
Determine a possible ordered pair that meets each criteria.
Point A is in quadrant IV: ________
Point B is on the x axis:________
Point C is in quadrant I: _______
Answers vary
400
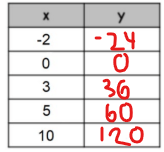
Write an equation to represent the table.
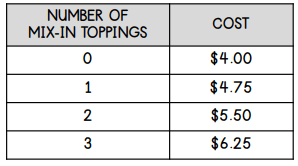
y = 0.75x + 4
400
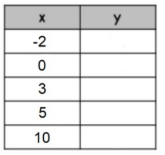
Complete the table to represent the equation
y = 12x
400
Get creative! Come up with a way to remember the x-axis shows the independent variable and the y-axis shows the dependent variable.
answers vary
400
Which of the following represent a proportional relationship?
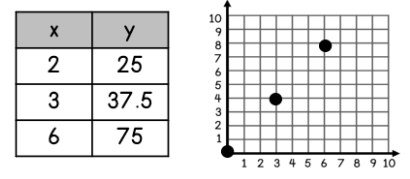
Both the table and graph
500
Which ordered pairs have the same y-coordinate?
I (-2, 0.5) II (0, 0.5) III (-2, -1.5)
IV (-0.5, 0.5) V (-2, -1)
I, II & IV
500
Write an equation to represent the table:
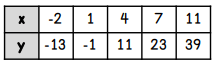
y = 6x - 5
500
Ken has a weekly goal of burning 2400 calories by taking brisk walks. While walking, Ken burns 300 calories per hour.
Write an equation to represent the relationship between x, the number of hours Ken walks and y, the amount of calories Kan has left to burn.
y = -300x + 2400
500
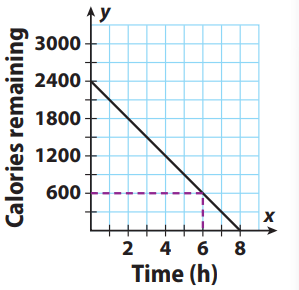
The graph shows the weight of a cross-country team's beverage cooler based on how much sports drink it contains.
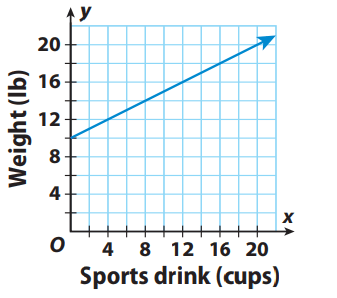
Which statement is NOT true.
A: The graph shows a non-proportional relationship
B: When 40 cups of sport drink is added to the cooler will weigh 40 pounds
C: The cooler weighs 10 lbs when empty
D: The rate of change is 0.5
B: When 40 cups of sport drink is added to the cooler will weigh 40 pounds
500
The table shows a non-proportional relationship. What is the y-intercept for the table?
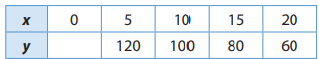
(0,140)